Bed Bath & Beyond
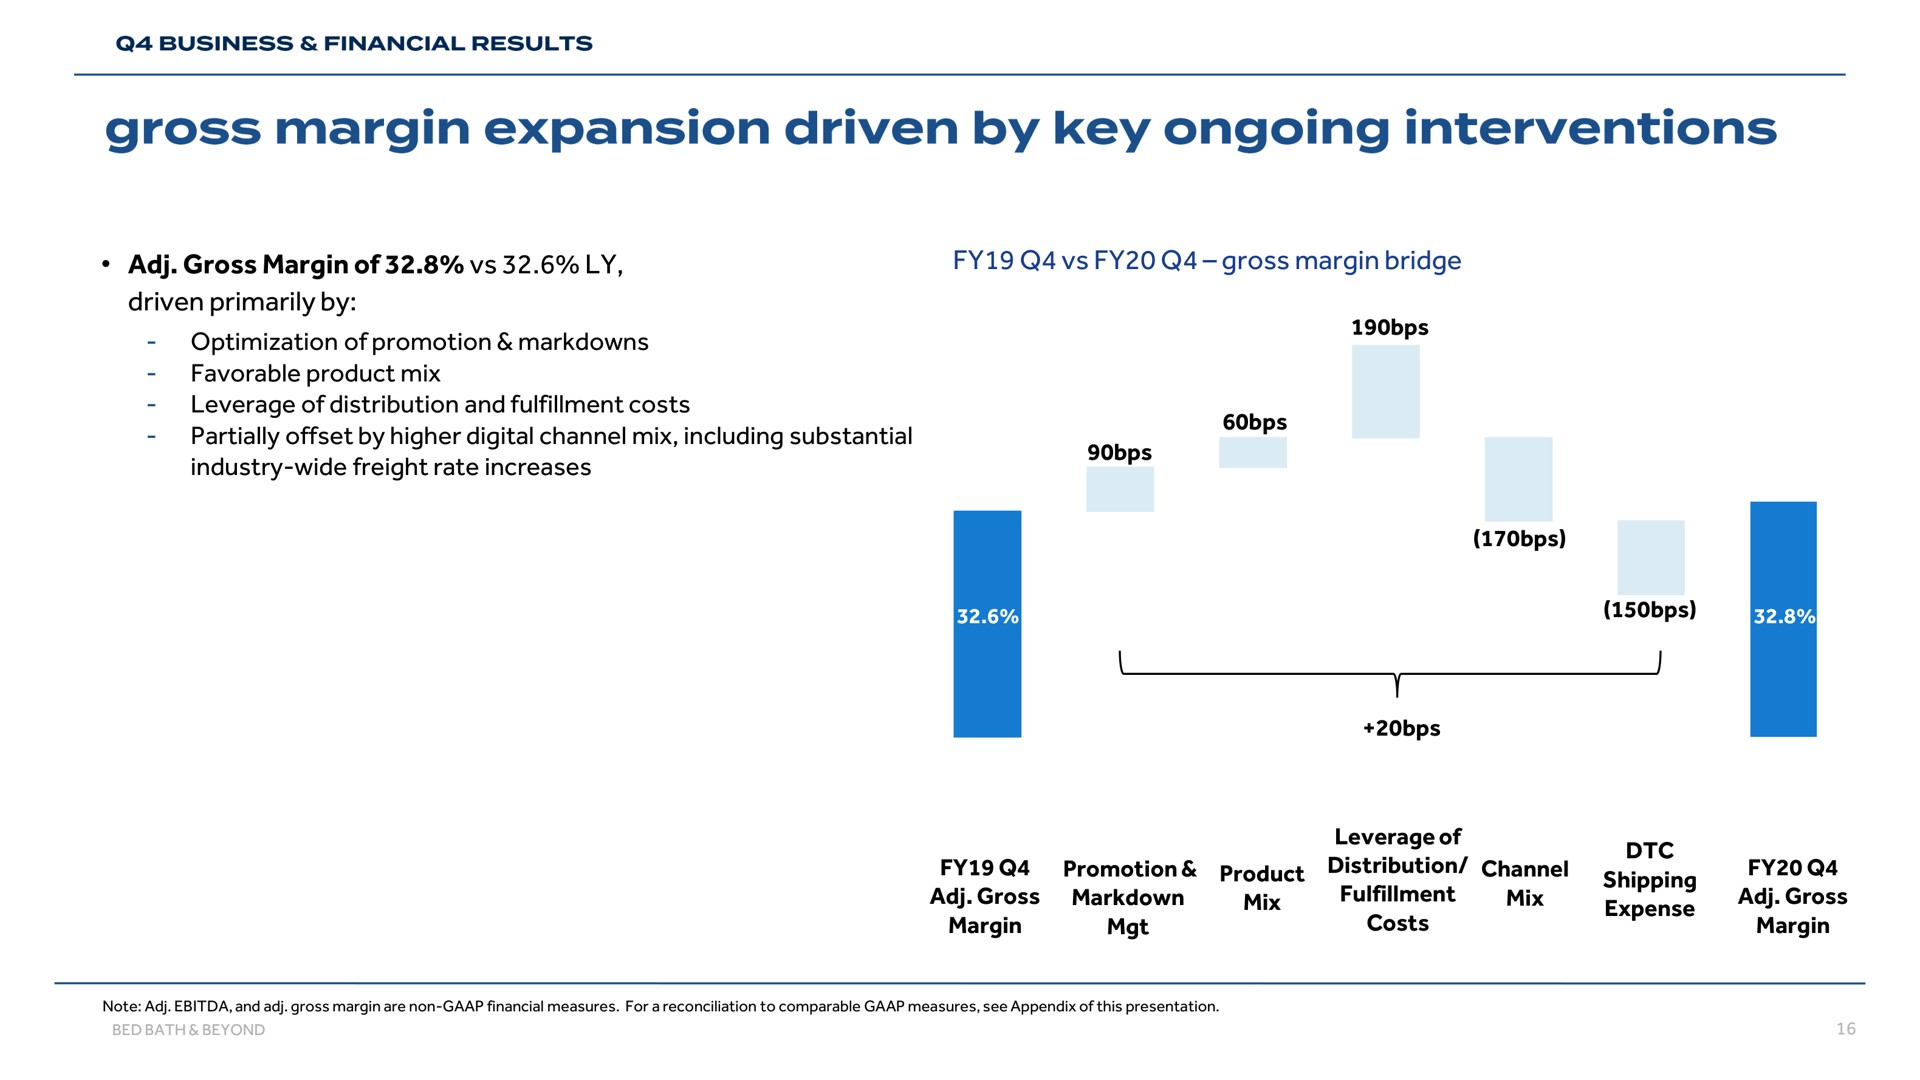
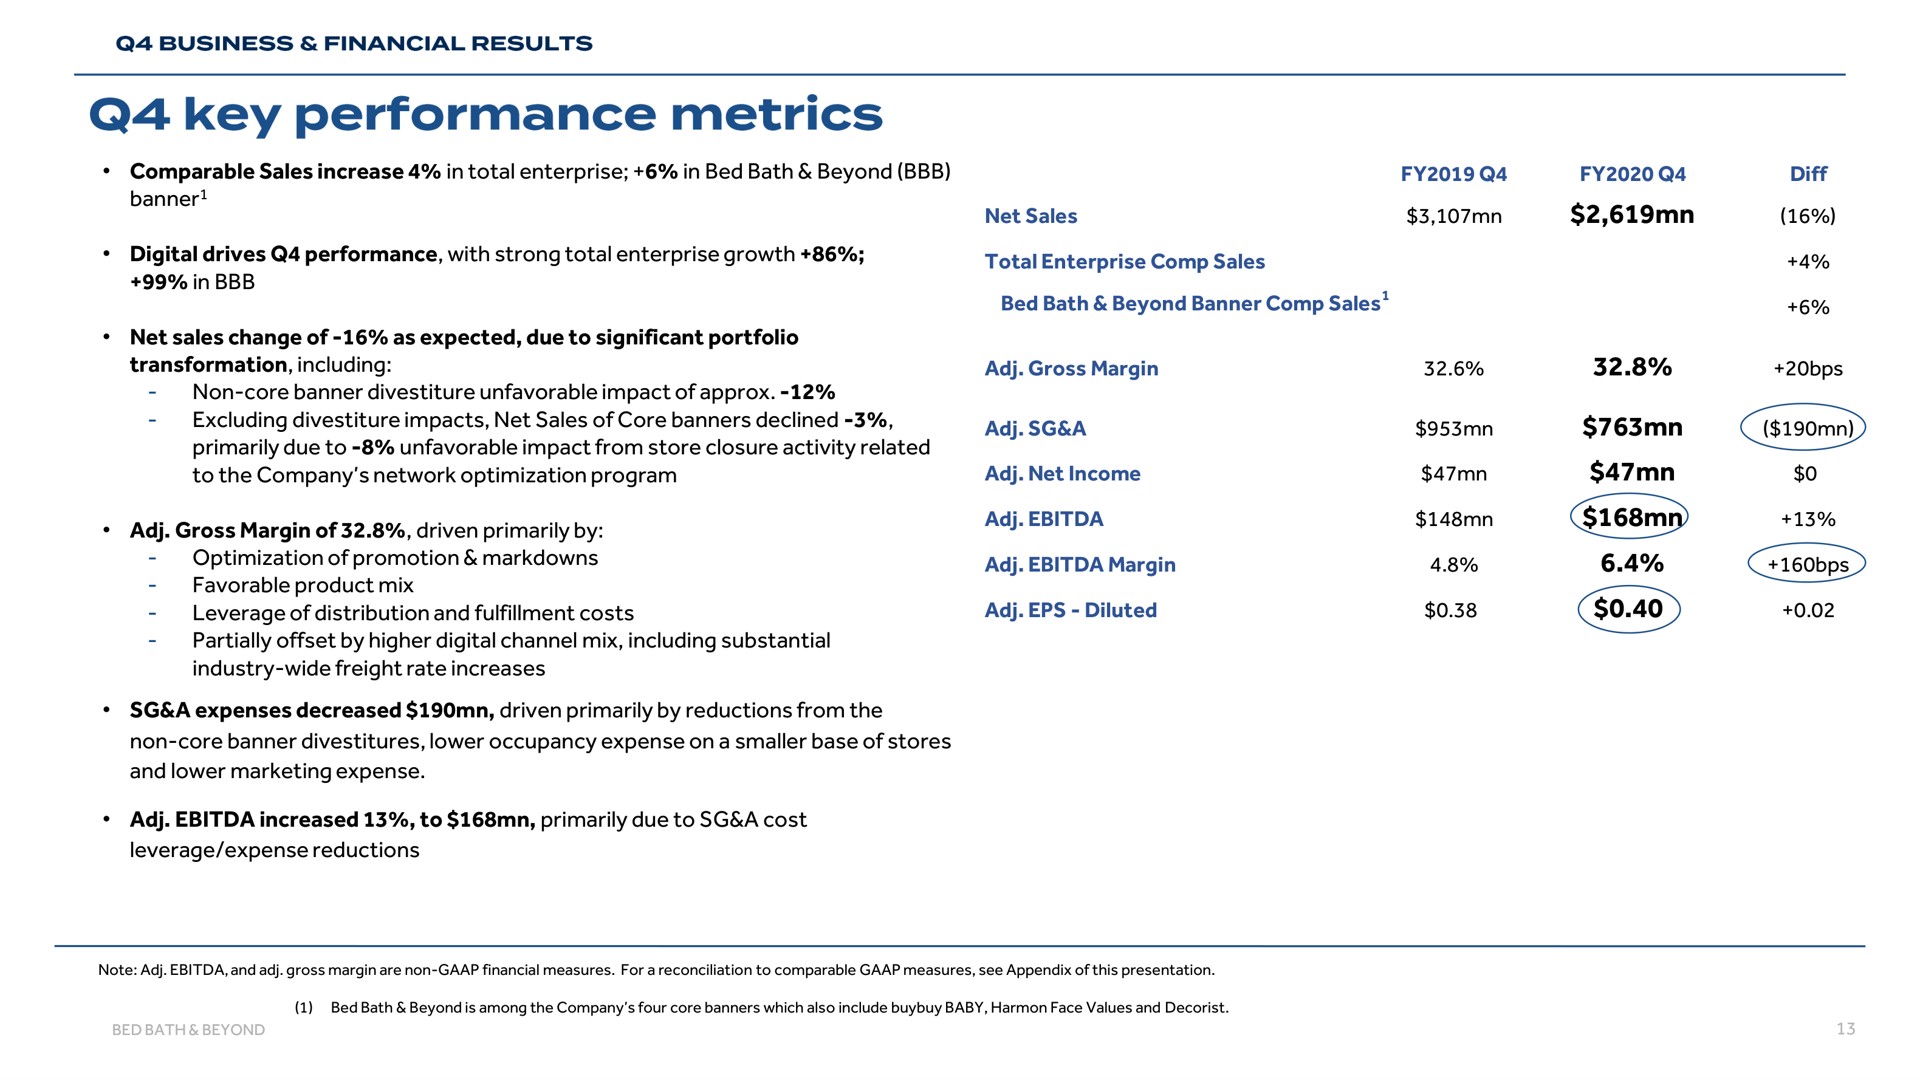
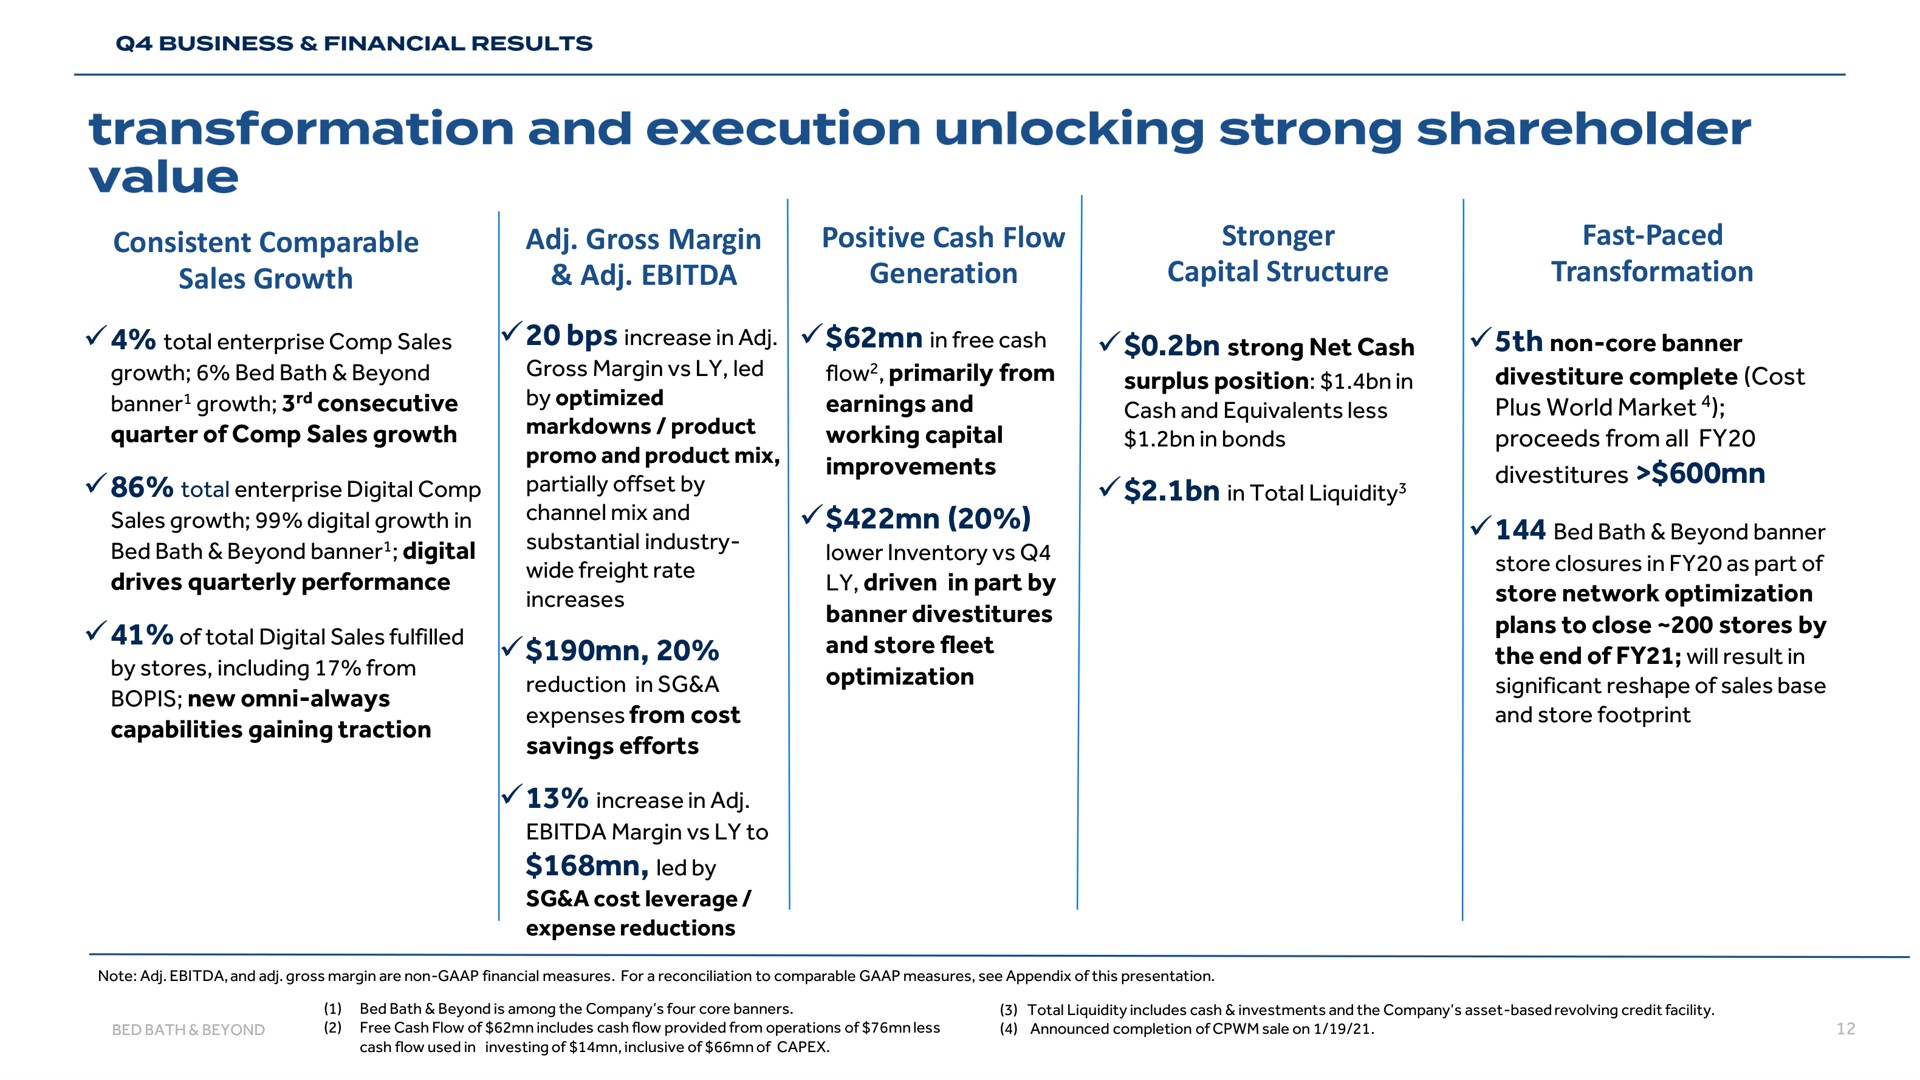
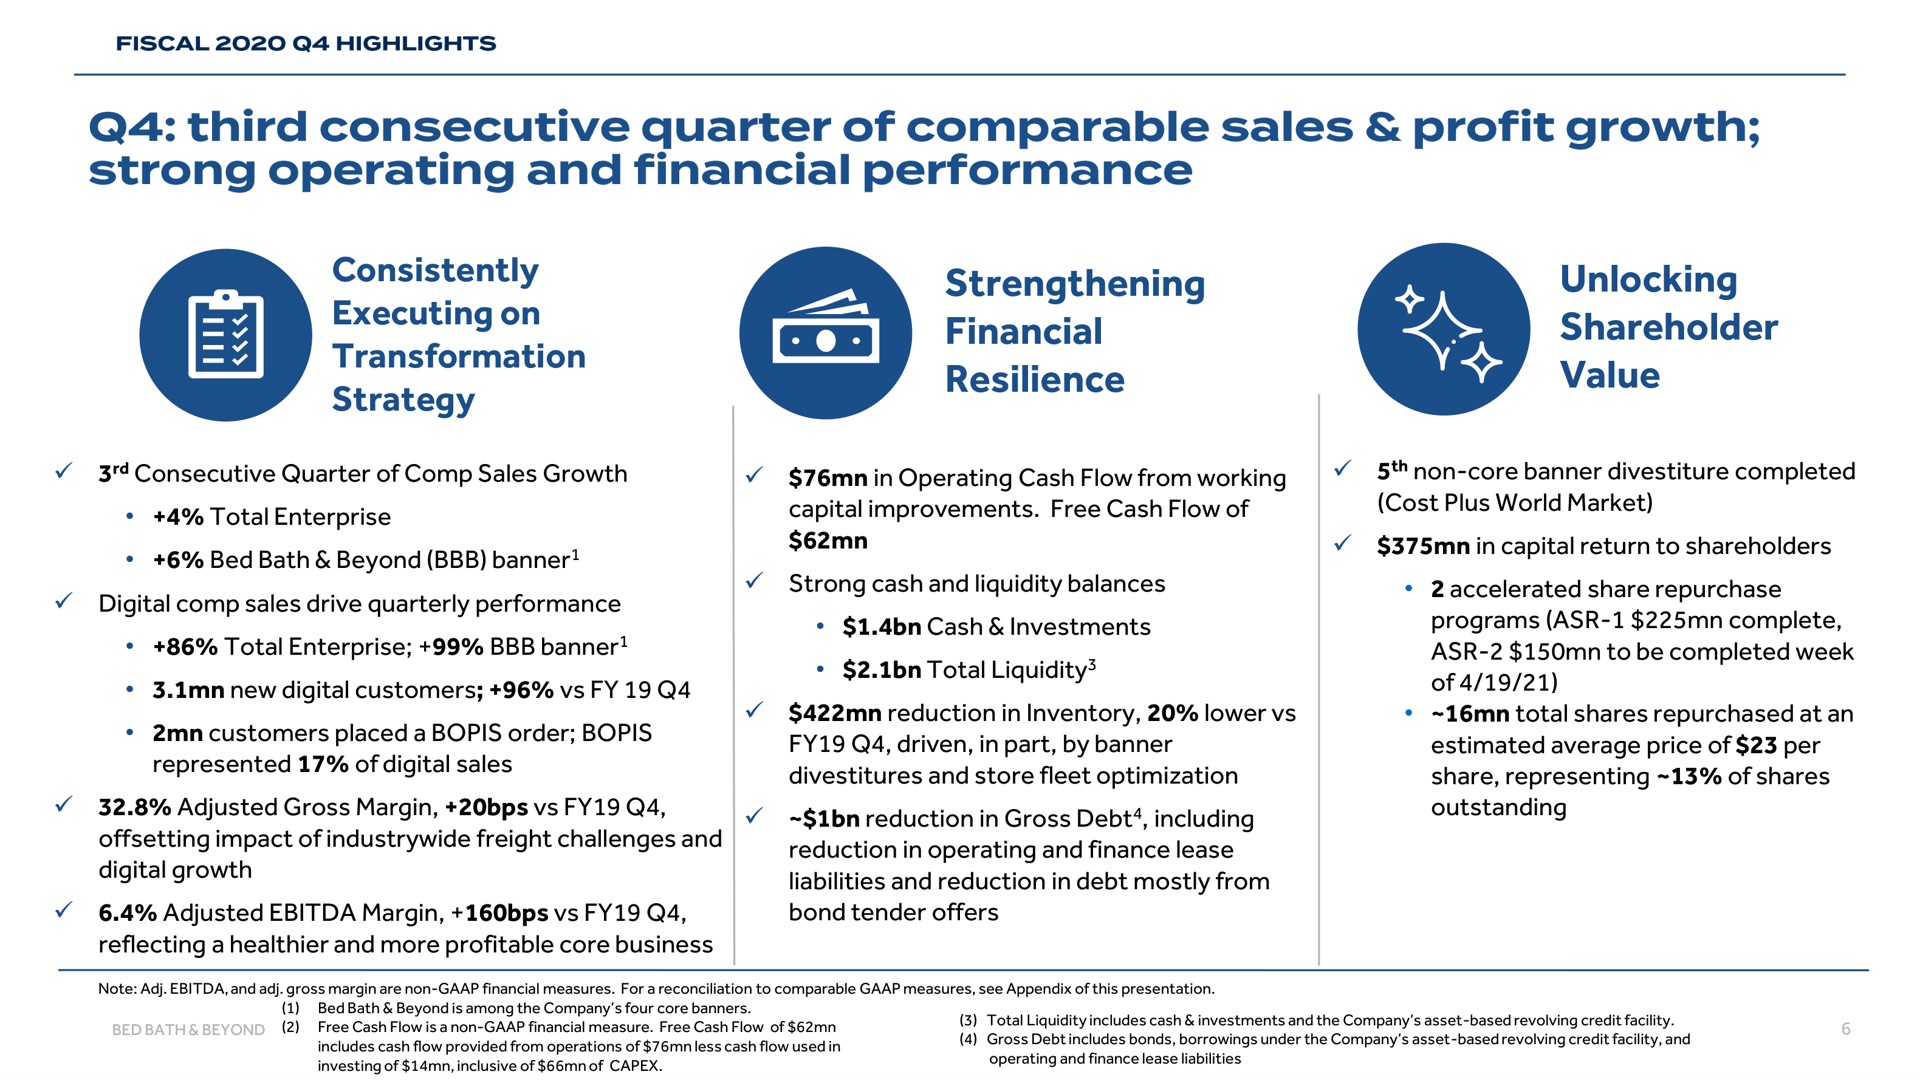
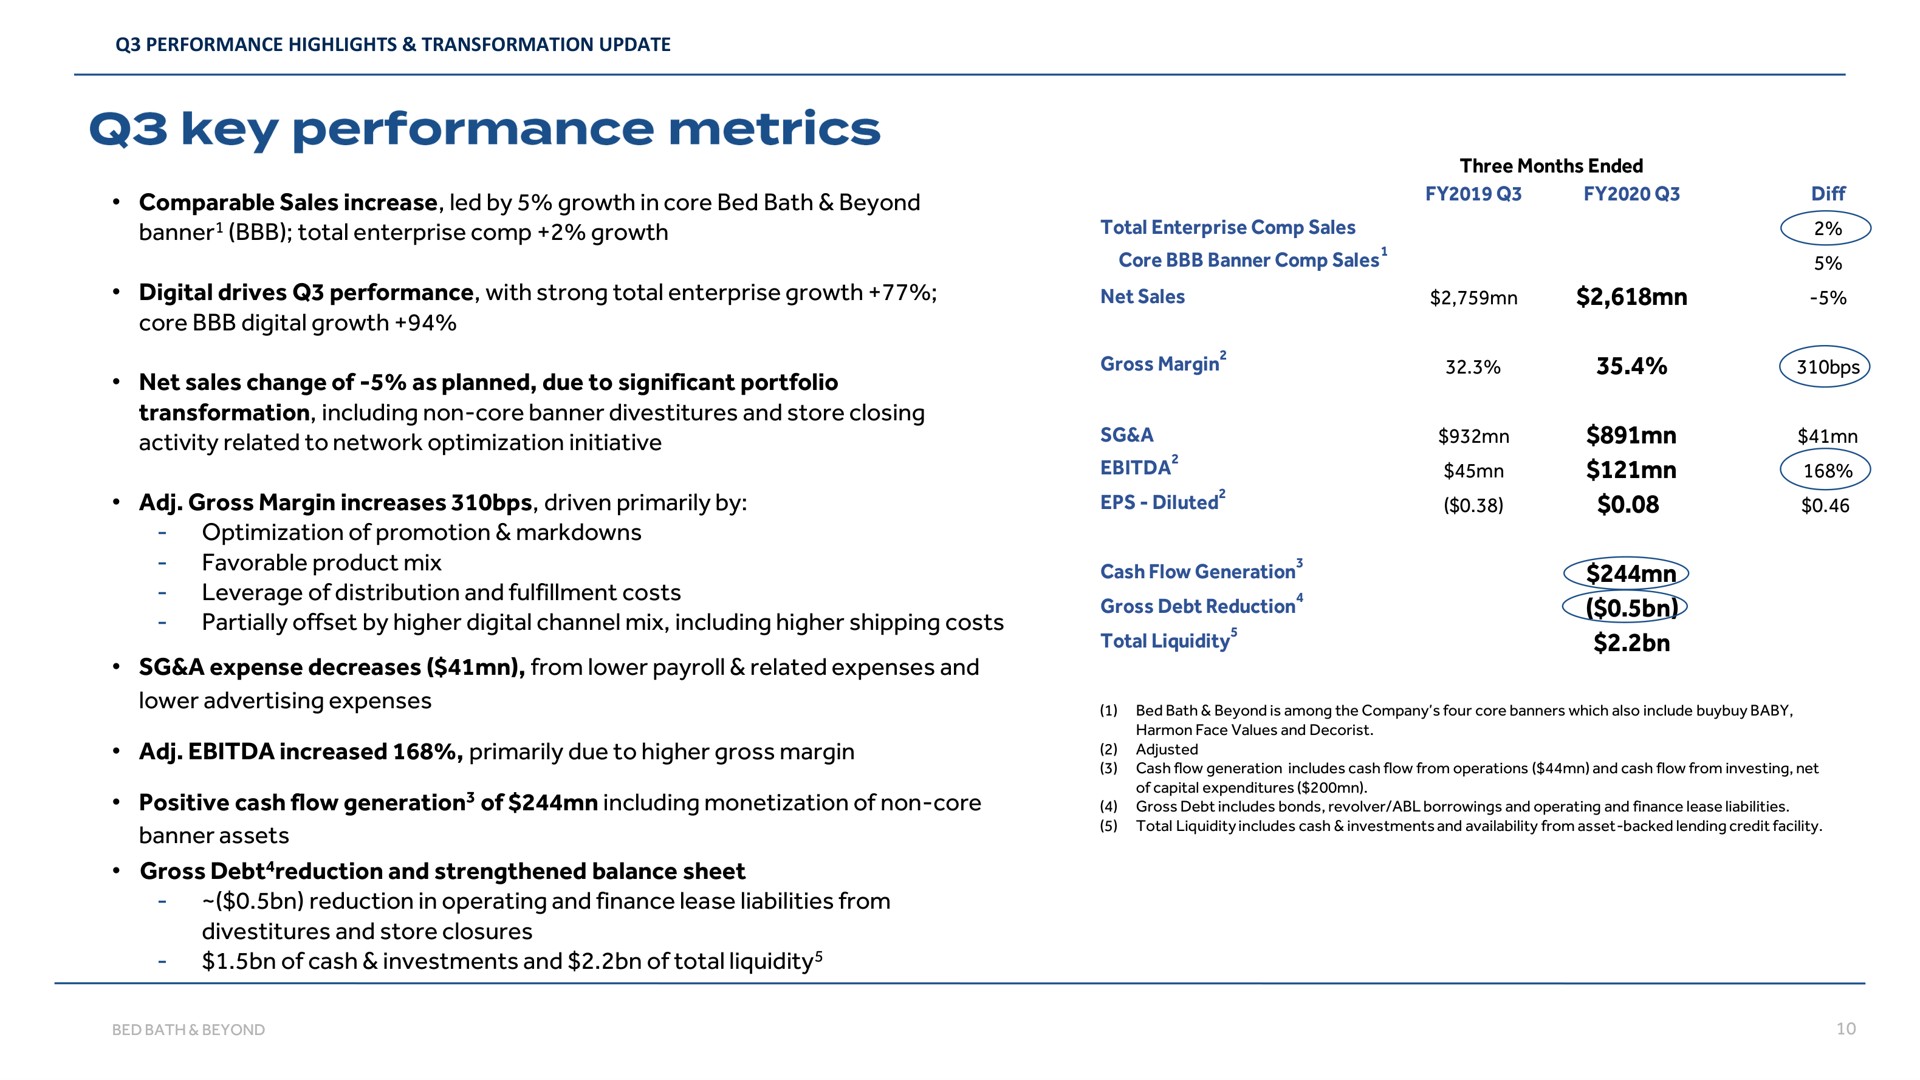
comparable sales increase led by growth in core bed bath beyond banner total enterprise growth digital drives performance with strong total enterprise growth core digital growth net sales change of as planned due to significant portfolio transformation including non core banner divestitures and store closing activity related to network optimization initiative gross margin increases driven primarily by optimization of promotion favorable product mix leverage of distribution and fulfillment costs partially offset by higher digital channel mix including higher shipping costs a expense decreases from lower payroll related expenses and lower advertising expenses increased primarily due to higher gross margin positive cash flow generation of including monetization of non core banner assets gross debt reduction and strengthened balance sheet reduction in operating and finance lease liabilities from divestitures and store closures of cash investments and of total liquidity key metrics | Bed Bath & Beyond
Deck Type
Deck date
January 2021
Slide
10 of 43
Similar slides by Bed Bath & Beyond
Results
April 2021
Results
April 2021
Results
April 2021
Results
April 2021
Related slides by other companies
Results
July 2022
Investor Conference
January 2024
Investor Presentation
May 2023
Results
October 2022
Other recent decks by Bed Bath & Beyond
Results
September 2022
Investor Day
August 2022
Results
June 2022
Results
April 2022
Search Thousands of Presentations by World Leading Companies

Stay in the loop

Join our mailing list to stay in the loop with updates and newest feature releases
© 2021-2023 Slidebook.io