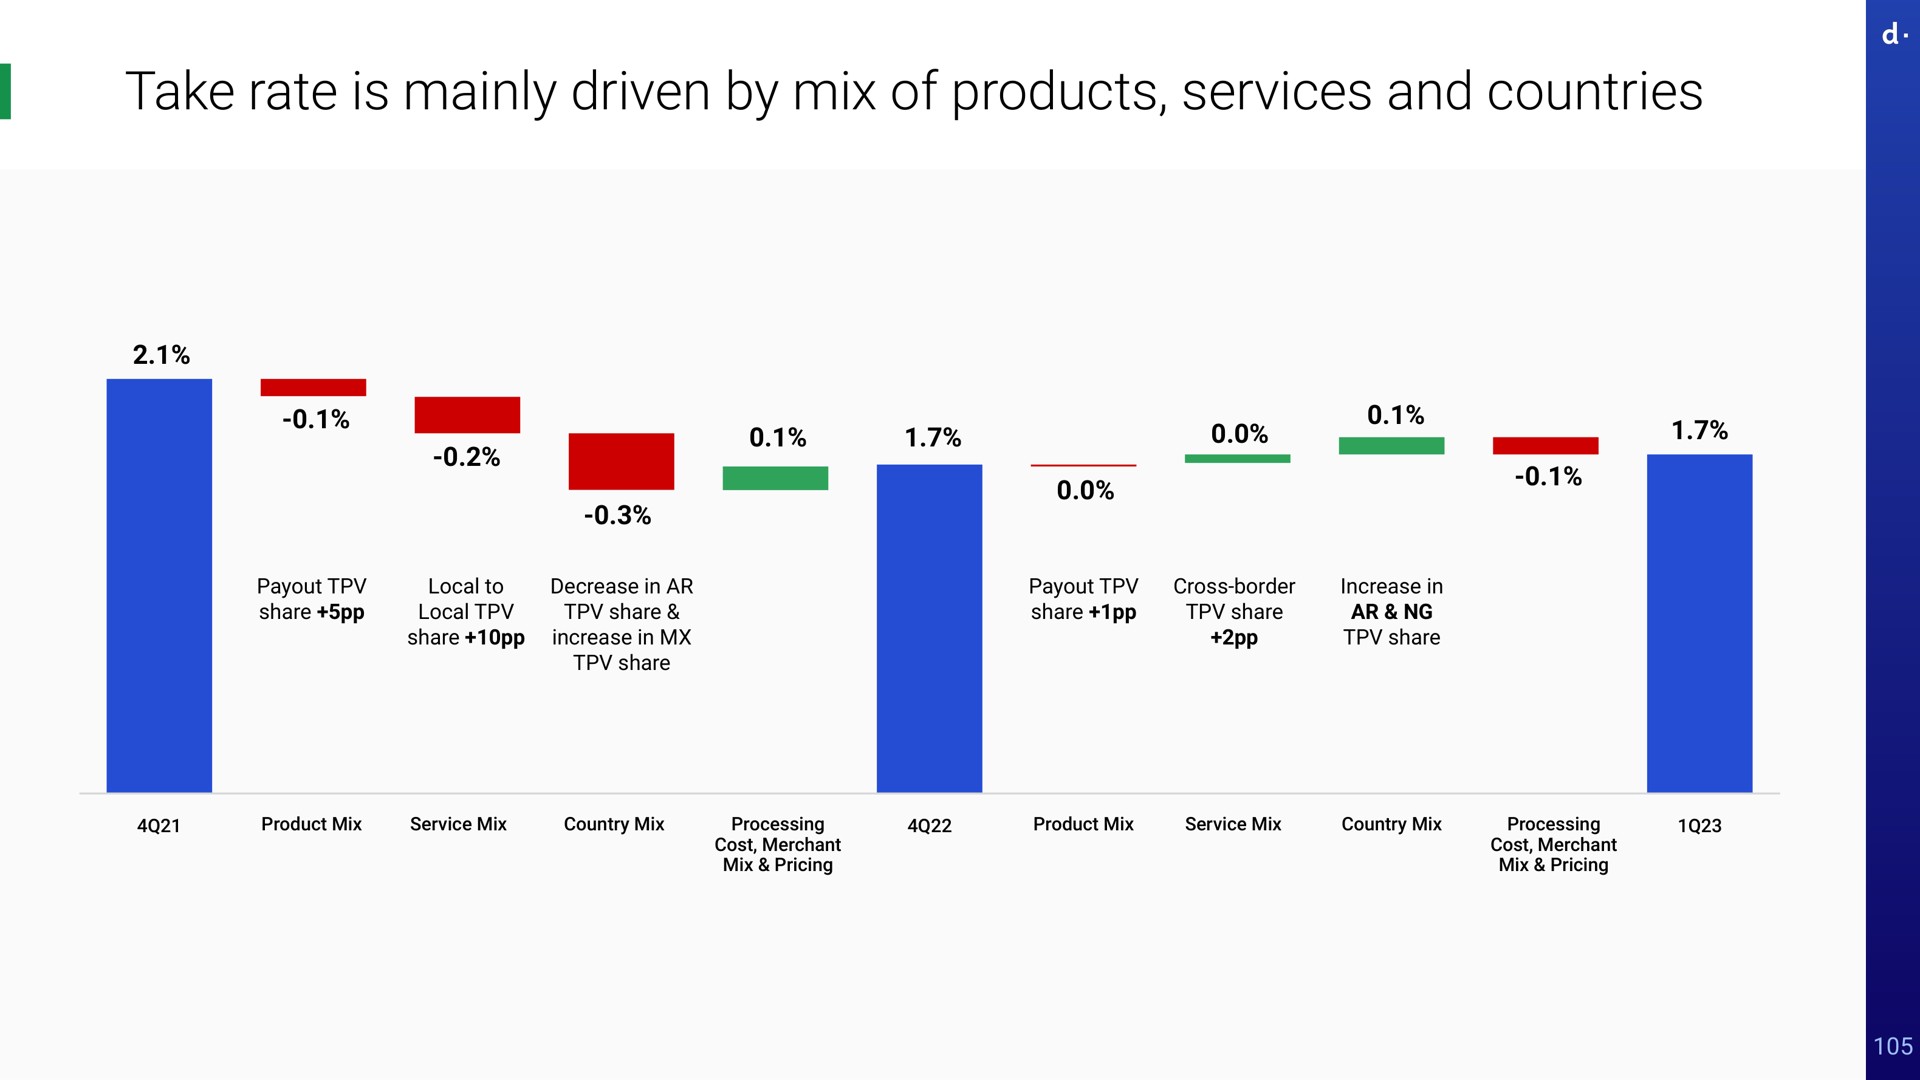
dLocal

Company
Deck Type
Sector
Industry
Deck date
June 2023
Slide
105 of 114
Related slides by other companies
Results
March 2021
Investor Conference
February 2023
Investor Presentation
February 2024
Results
March 2022
Other recent decks by dLocal
Search Thousands of Presentations by World Leading Companies
Stay in the loop
Join our mailing list to stay in the loop with updates and newest feature releases

© 2021-2023 Slidebook.io


