dLocal
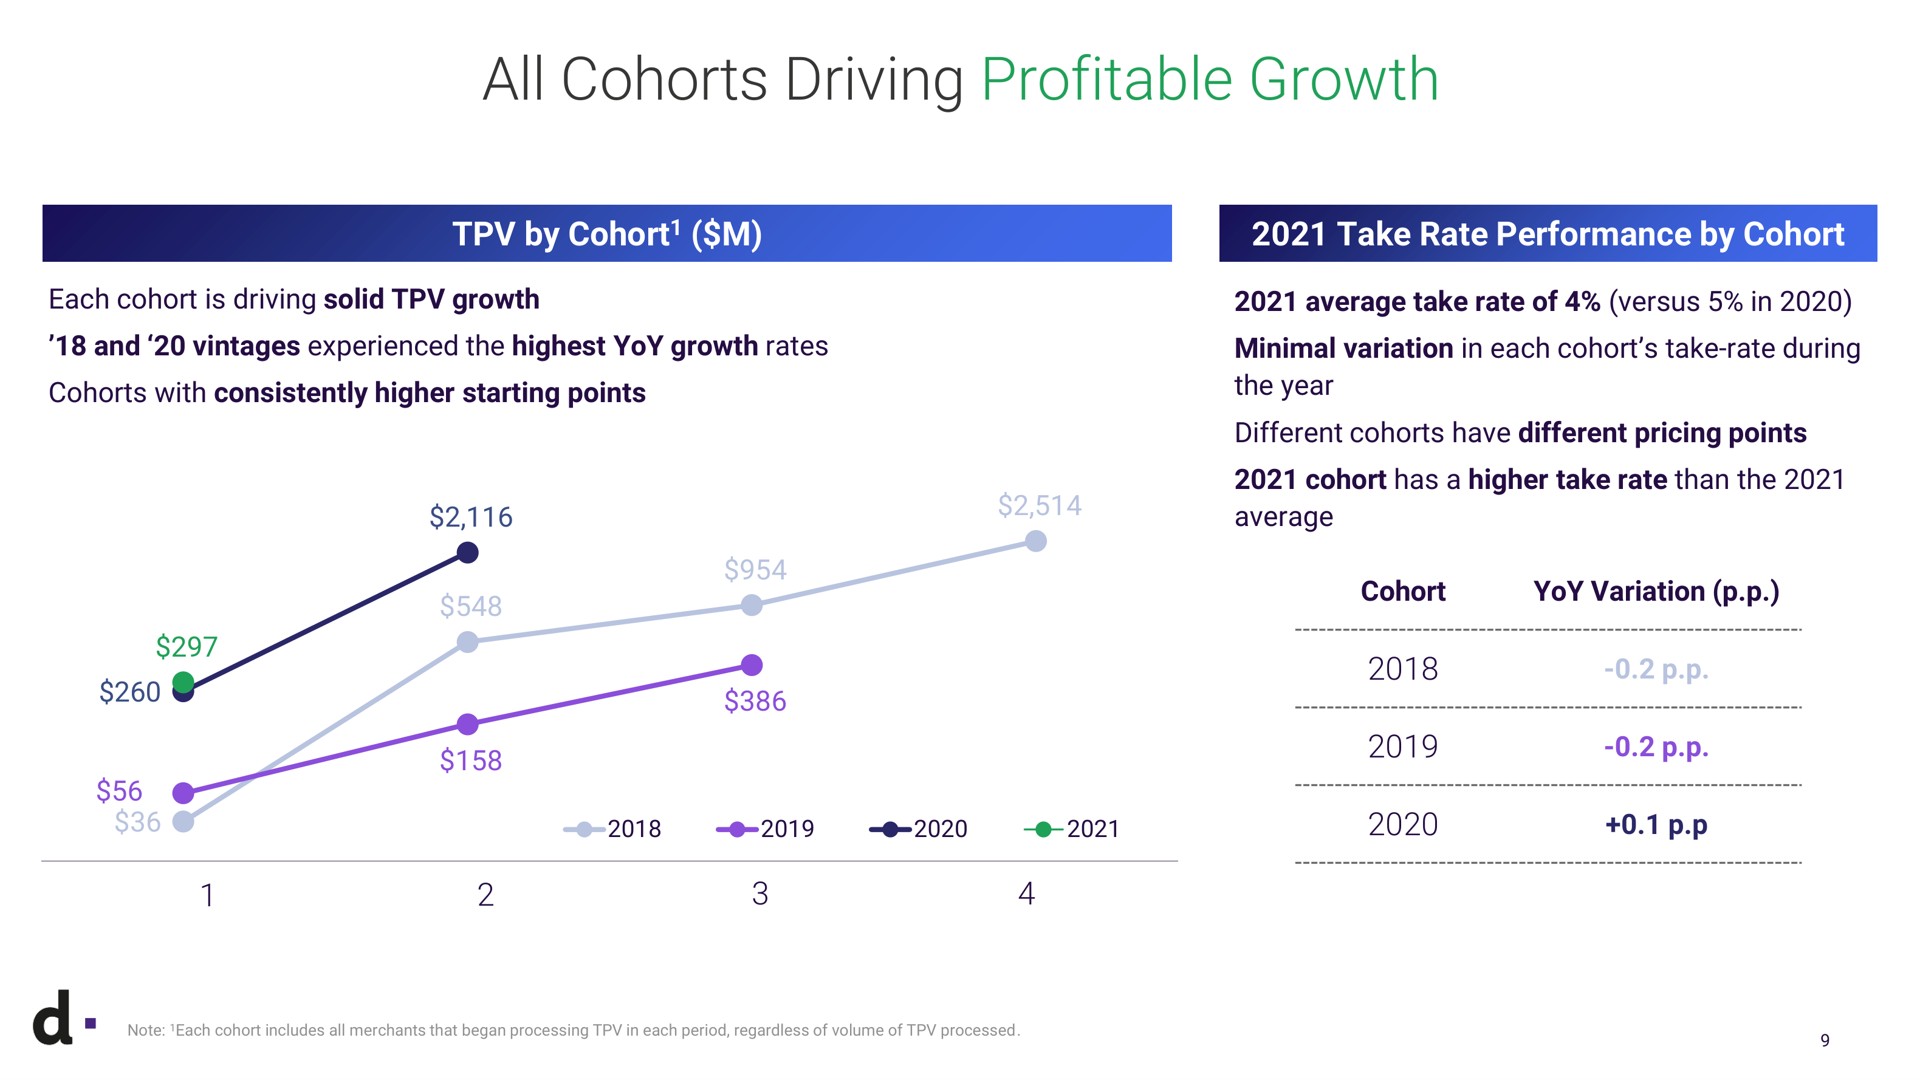
all cohorts driving profitable growth by cohort take rate performance by cohort each cohort is solid and vintages experienced the highest yoy rates with consistently higher starting points a note each cohort includes merchants that began processing in each period regardless of volume of processed average take rate of versus in minimal variation in each cohort take rate during the year different have different pricing points cohort has a higher take rate than the average cohort yoy variation | dLocal
Company
Deck Type
Deck date
March 2022
Slide
9 of 29
Related slides by other companies
SPAC
March 2022
Results
March 2024
Results
July 2022
Results
February 2019
Other recent decks by dLocal
Results
November 2023
Results
August 2023
Investor Day
June 2023
Results
May 2023
Search Thousands of Presentations by World Leading Companies

Stay in the loop

Join our mailing list to stay in the loop with updates and newest feature releases
© 2021-2023 Slidebook.io