J.P.Morgan
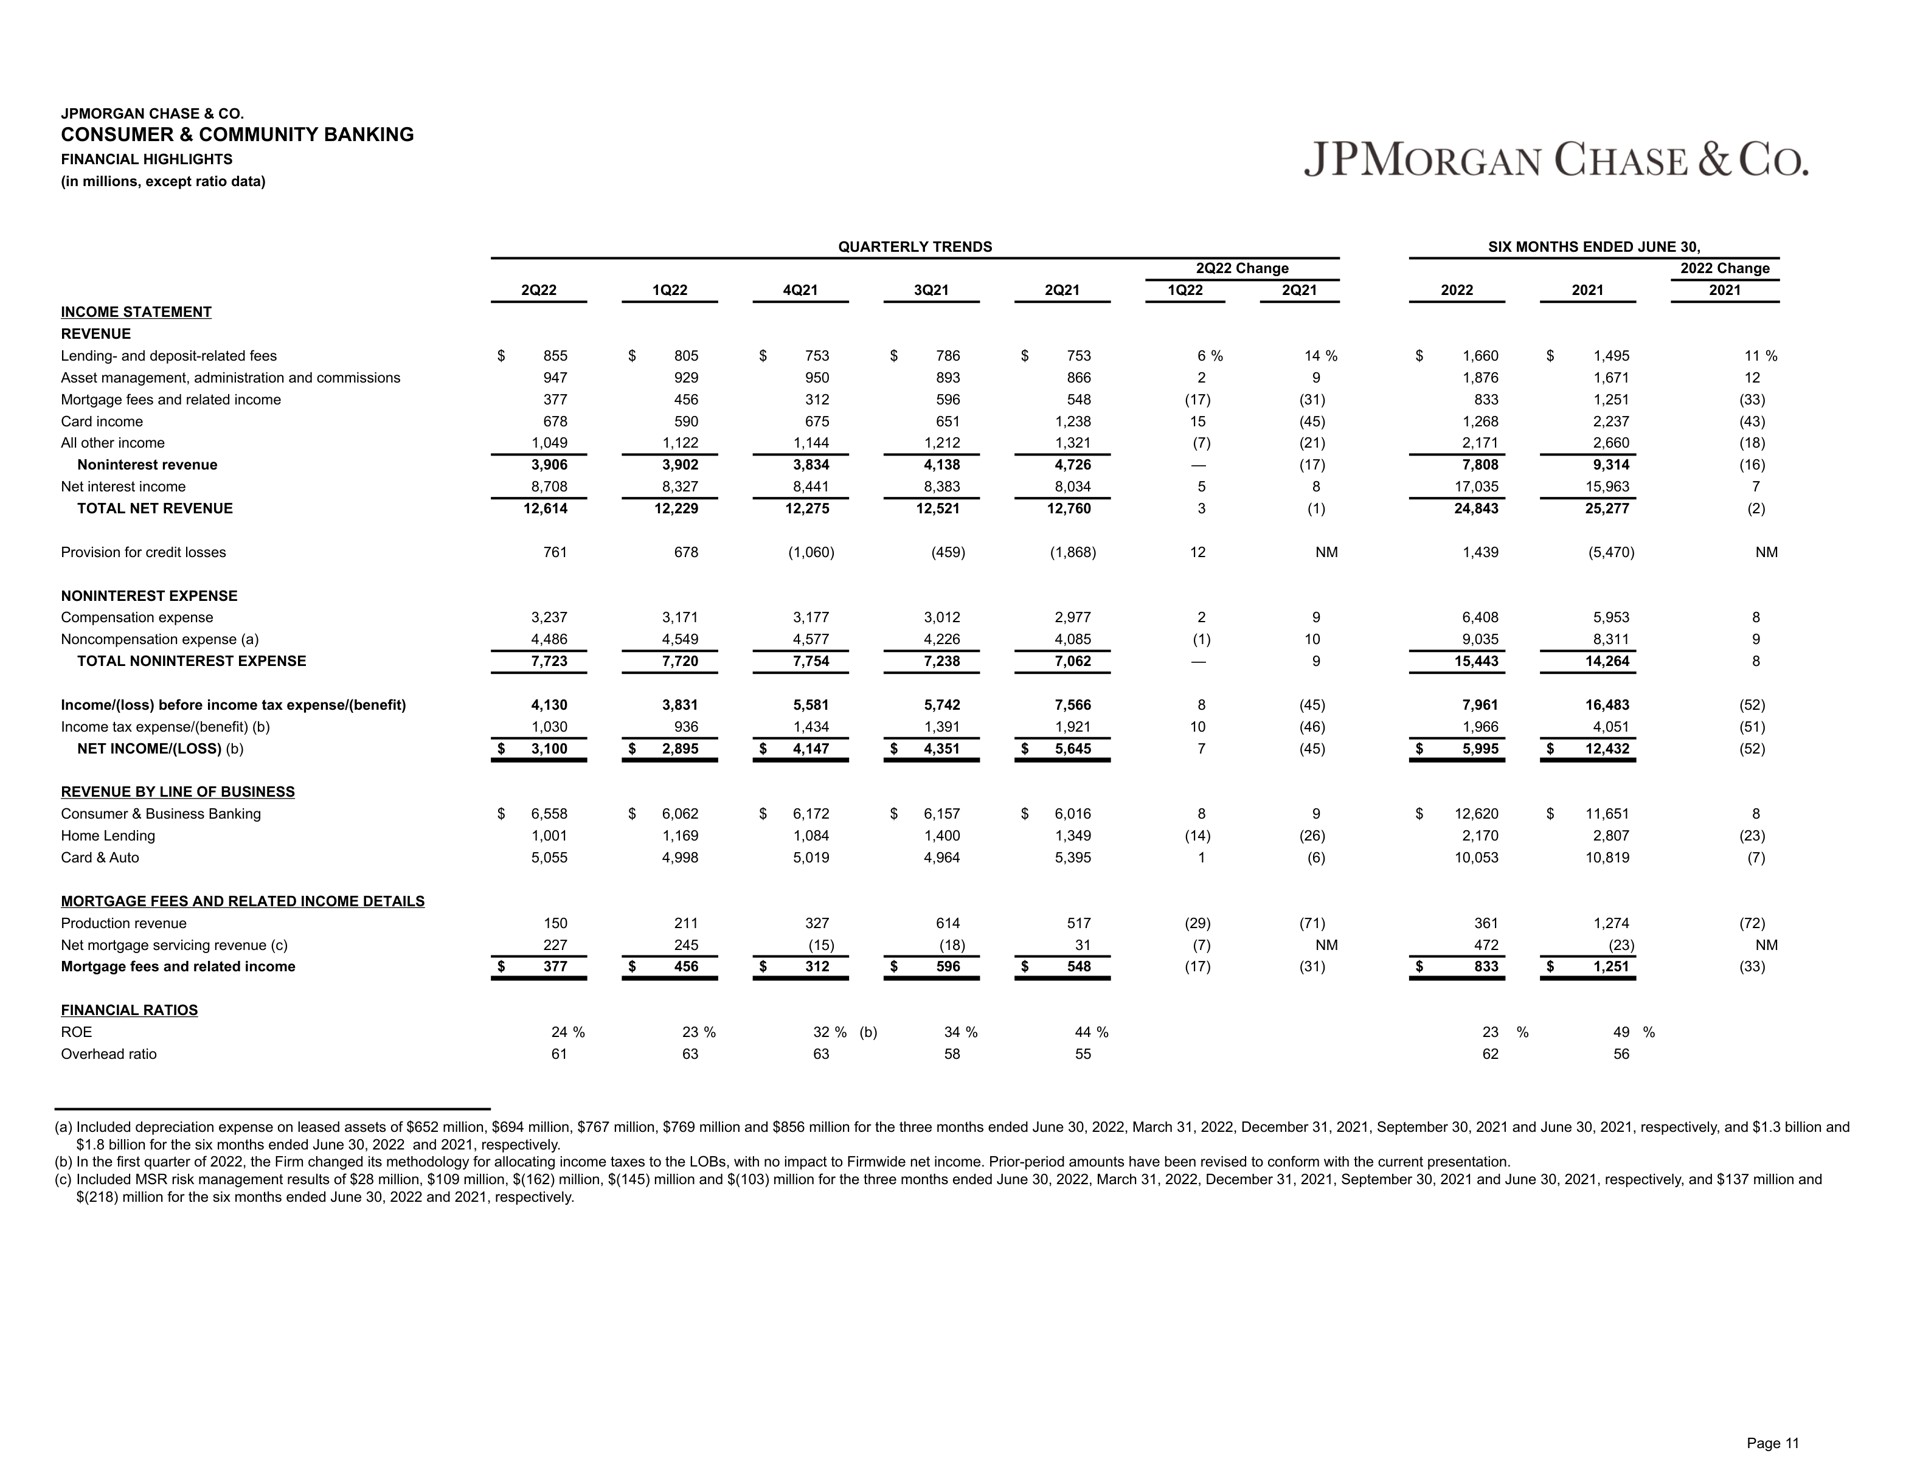
chase consumer community banking financial highlights in millions except ratio data change change quarterly trends six months ended june income statement revenue lending and deposit related fees asset management administration and commissions mortgage fees and related income card income all other income revenue net interest income total net revenue provision for credit losses expense compensation expense noncompensation expense a total expense income loss before income tax expense benefit income tax expense benefit net income loss revenue by line of business consumer business banking home lending card auto mortgage fees and related income details production revenue net mortgage servicing revenue mortgage fees and related income financial ratios roe overhead ratio a included depreciation expense on leased assets of million million million million and million for the three months ended june march and june respectively and billion and billion for the six months ended june and respectively in the first quarter of the firm changed its methodology for allocating income taxes to the lobs with no impact to net income prior period amounts have been revised to conform with the current presentation included risk management results of million million million million and million for the three months ended june march and june respectively and million and million for the six months ended june and respectively page | J.P.Morgan
Company
Deck Type
Deck date
July 2022
Slide
12 of 29
Similar slides by J.P.Morgan
Results
October 2024
Results
October 2024
Results
October 2024
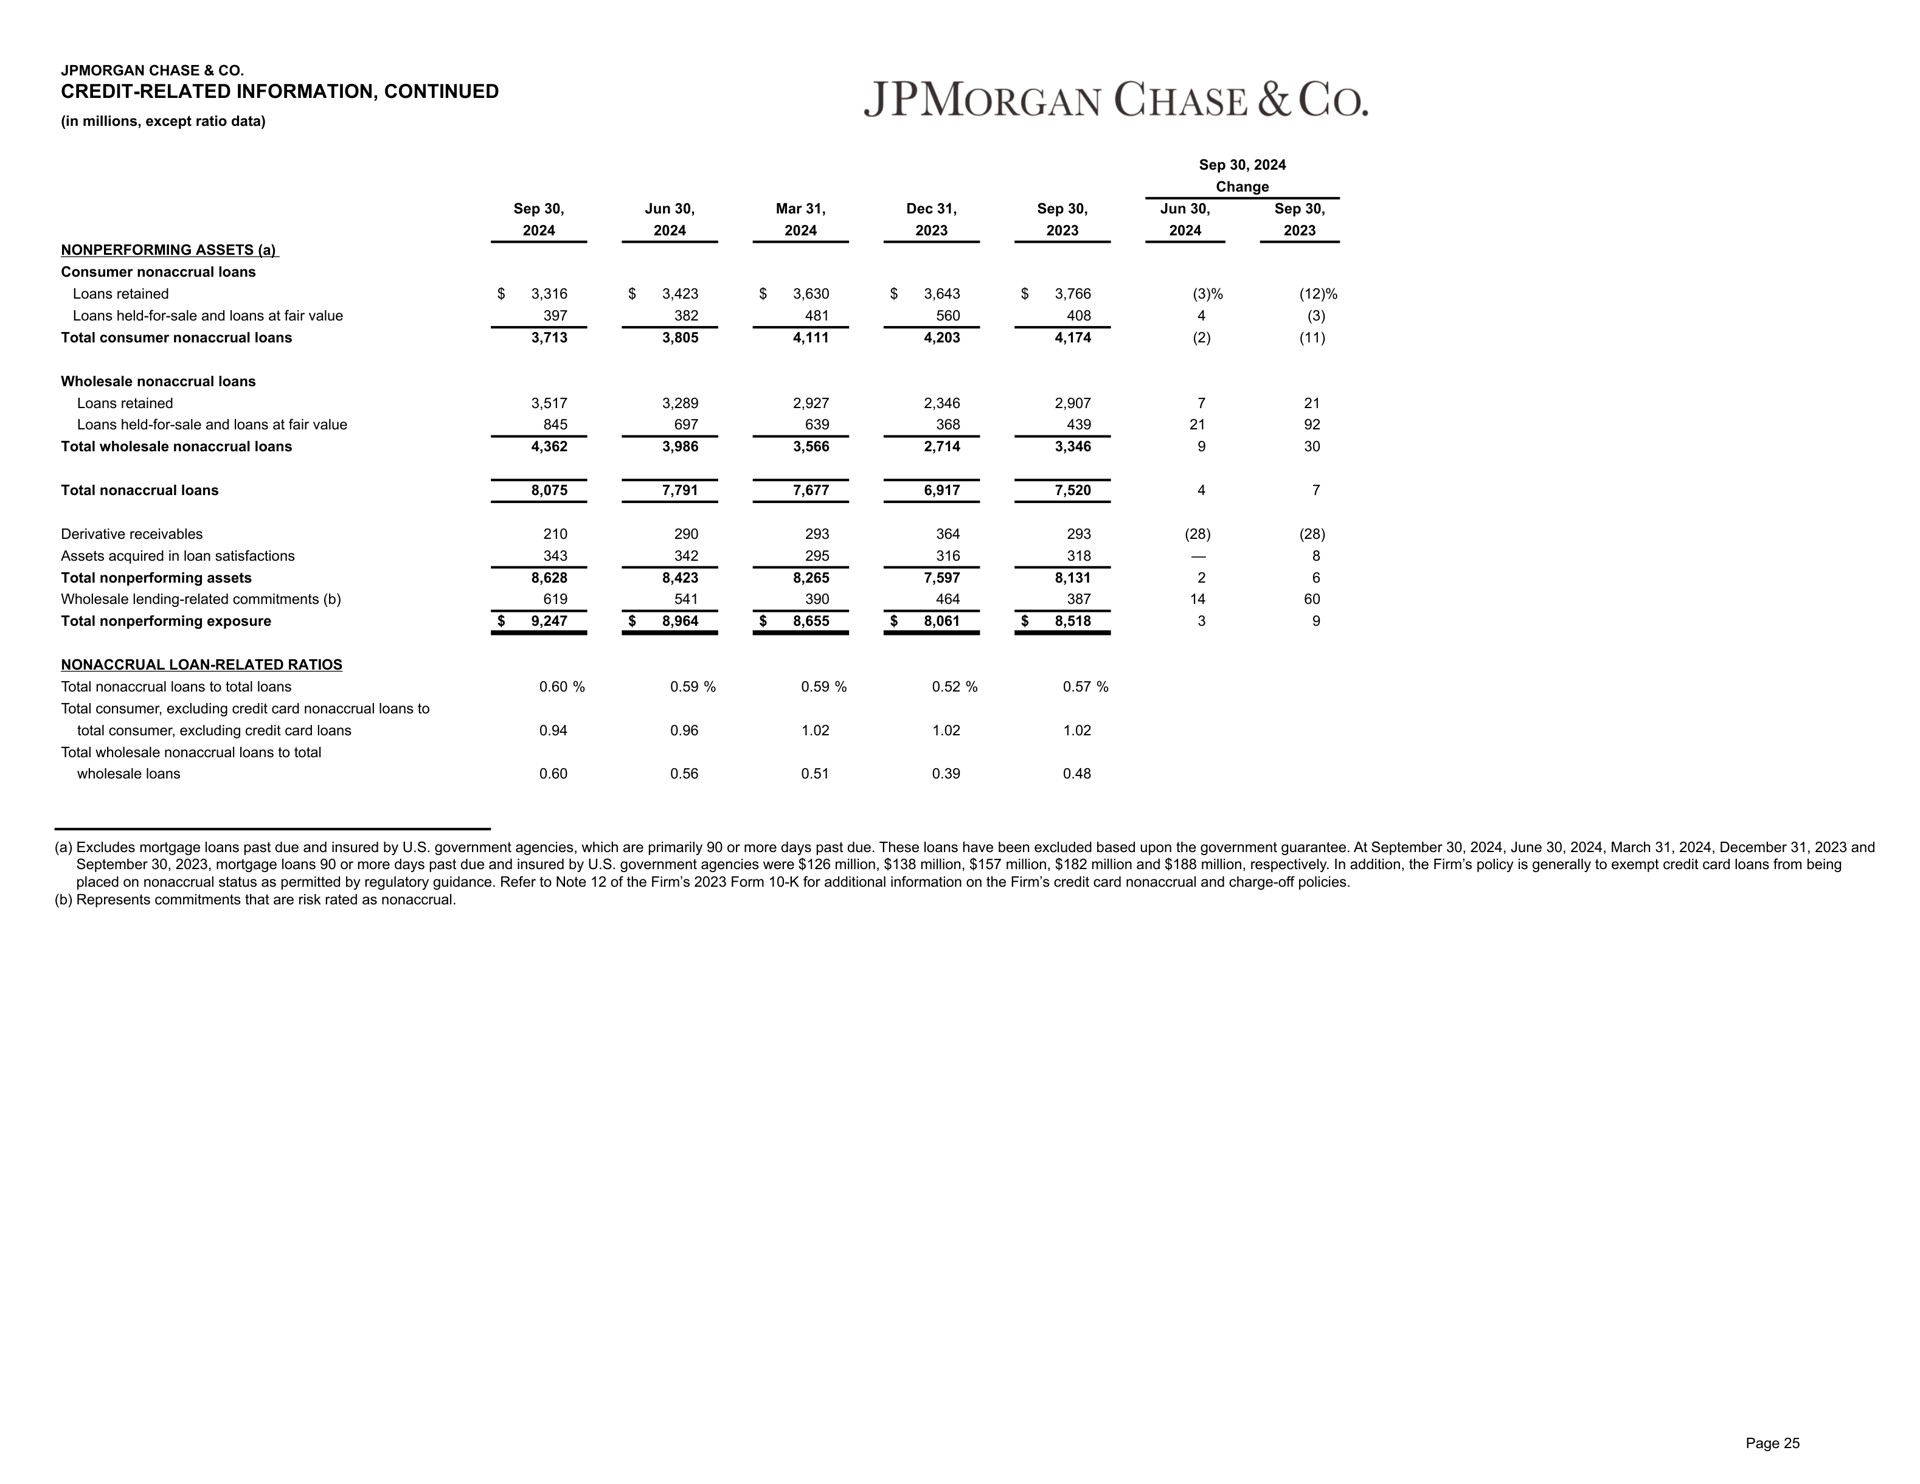
Results
October 2024
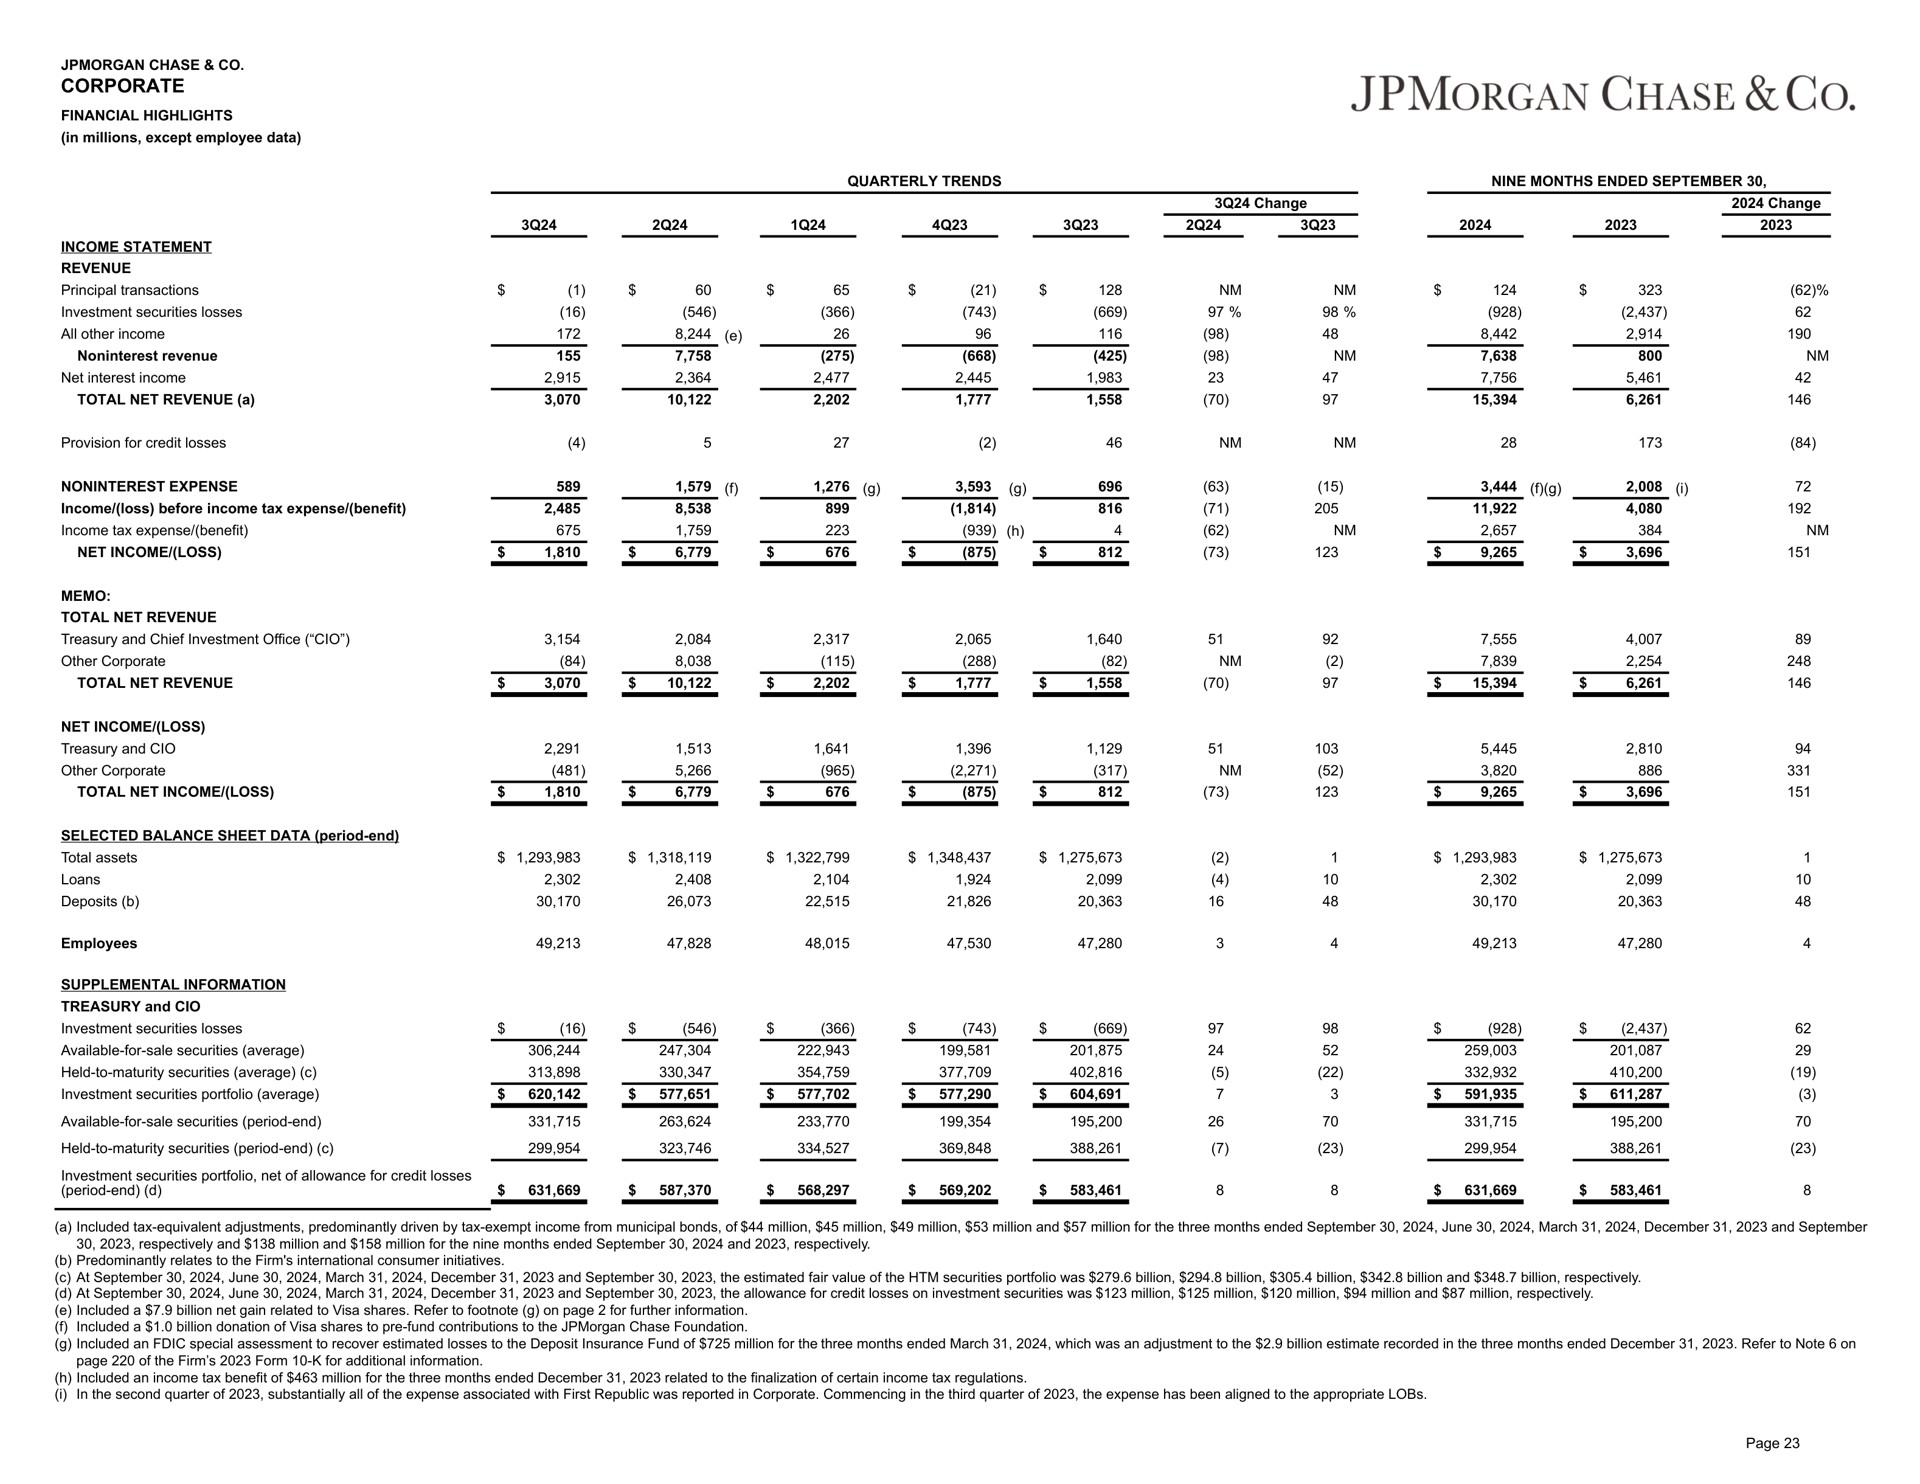
Related slides by other companies
Investor Presentation
February 2023
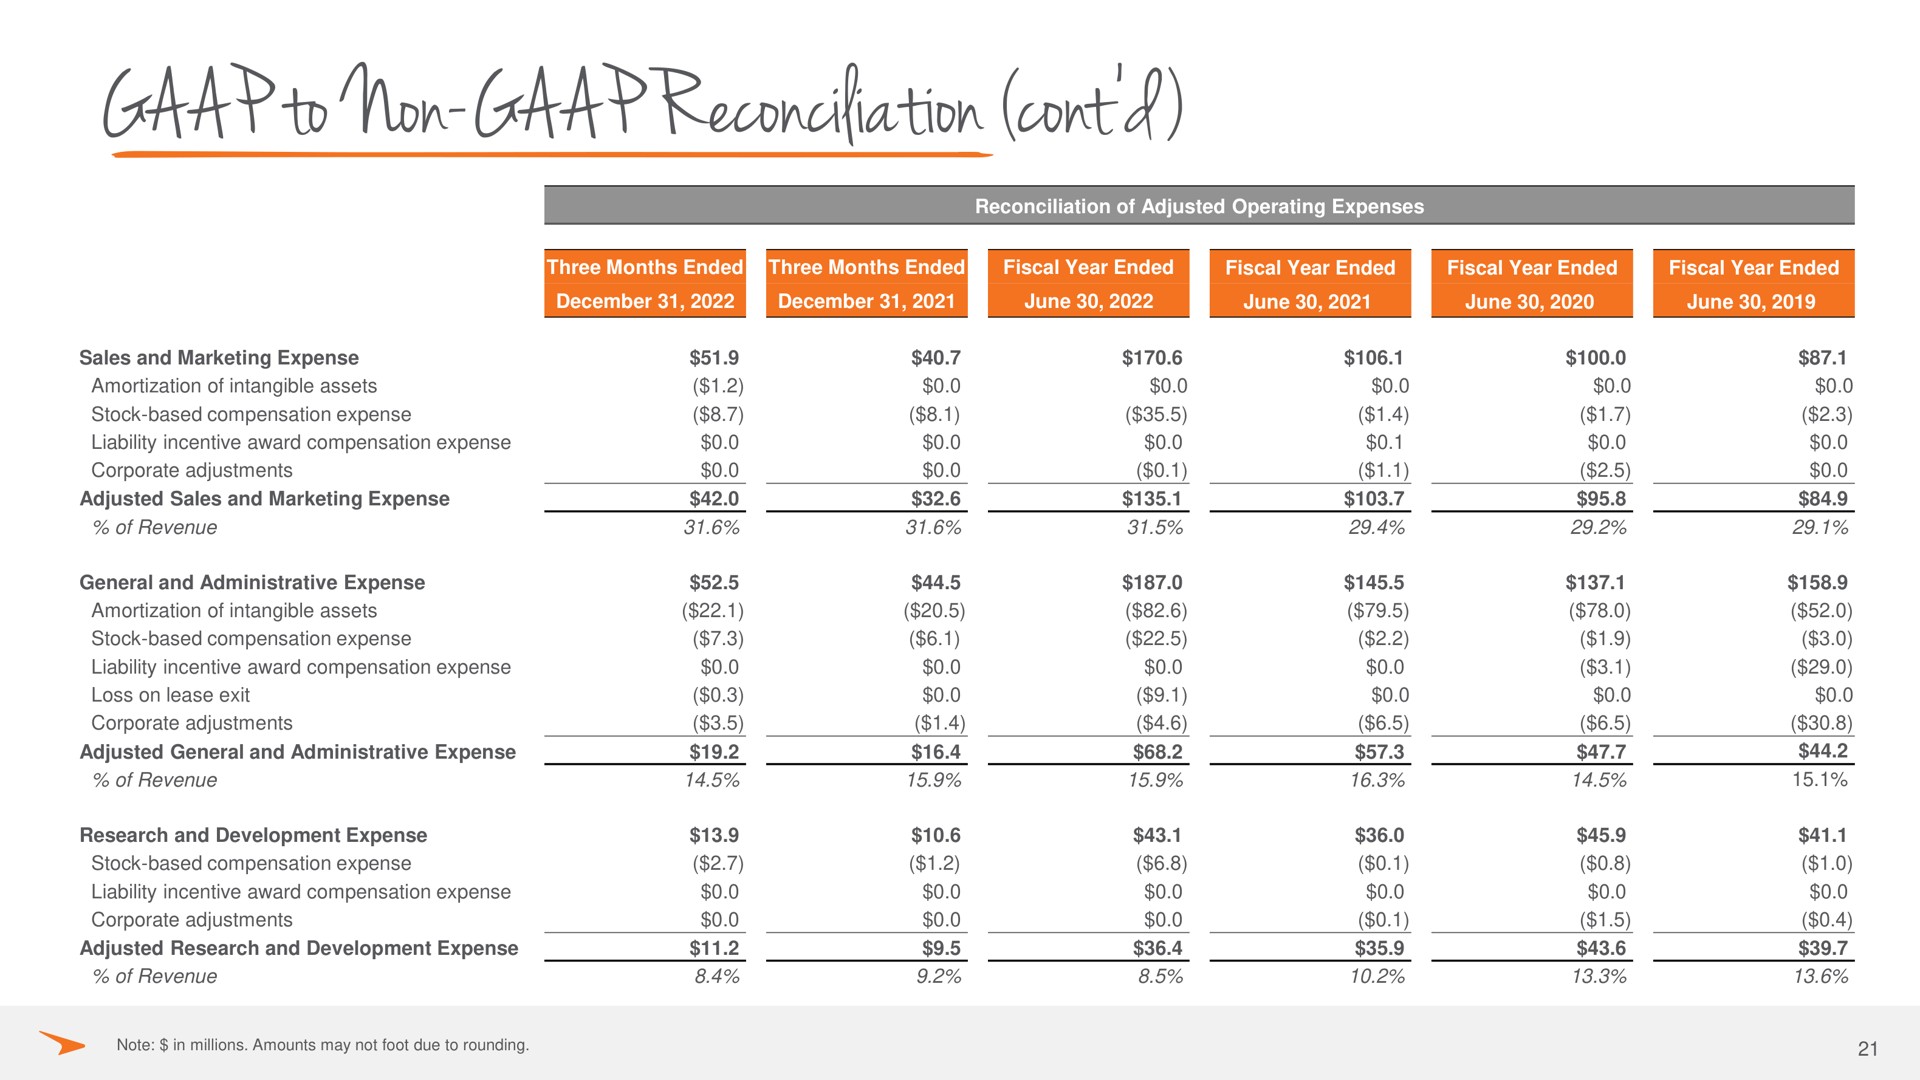
Investor Presentation
November 2023
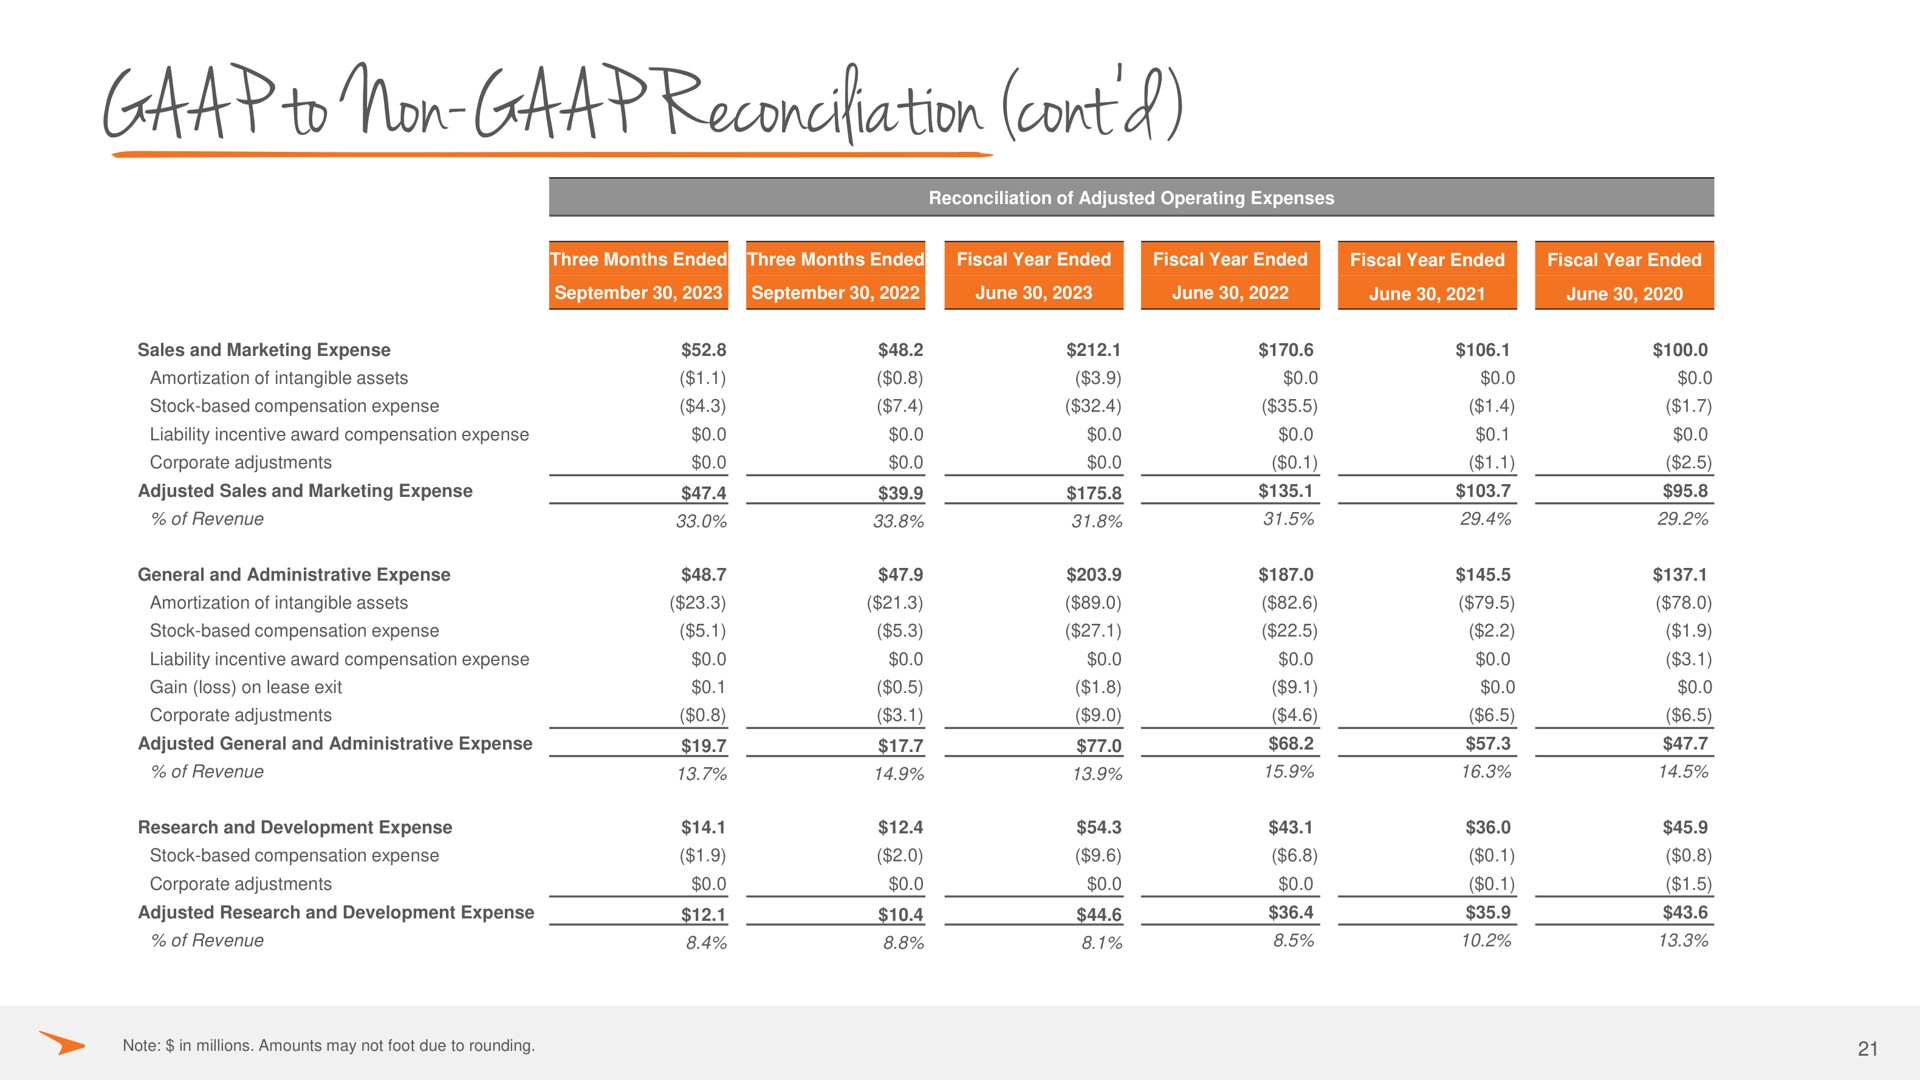
Investor Presentation
November 2022
Other recent decks by J.P.Morgan
Results
January 2025
Results
October 2024
Results
October 2024
Results
January 2024
Search Thousands of Presentations by World Leading Companies