J.P.Morgan
chase asset wealth management financial highlights in millions except ratio and data quarterly trends full year change change income statement revenue asset management administration and commissions all other income revenue net interest income total net revenue provision for credit losses a a a expense compensation expense noncompensation expense total expense income before income tax expense income tax expense net income revenue by line of business asset management global private bank total net revenue financial ratios roe overhead ratio margin ratio asset management global private bank asset wealth management number of global private bank client advisors a in the first quarter of the firm changed its methodology for allocating income taxes to the lobs with no impact to net income prior period amounts have been revised to conform with the current presentation page | J.P.Morgan
Company
Deck Type
Deck date
January 2023
Slide
22 of 30
Similar slides by J.P.Morgan
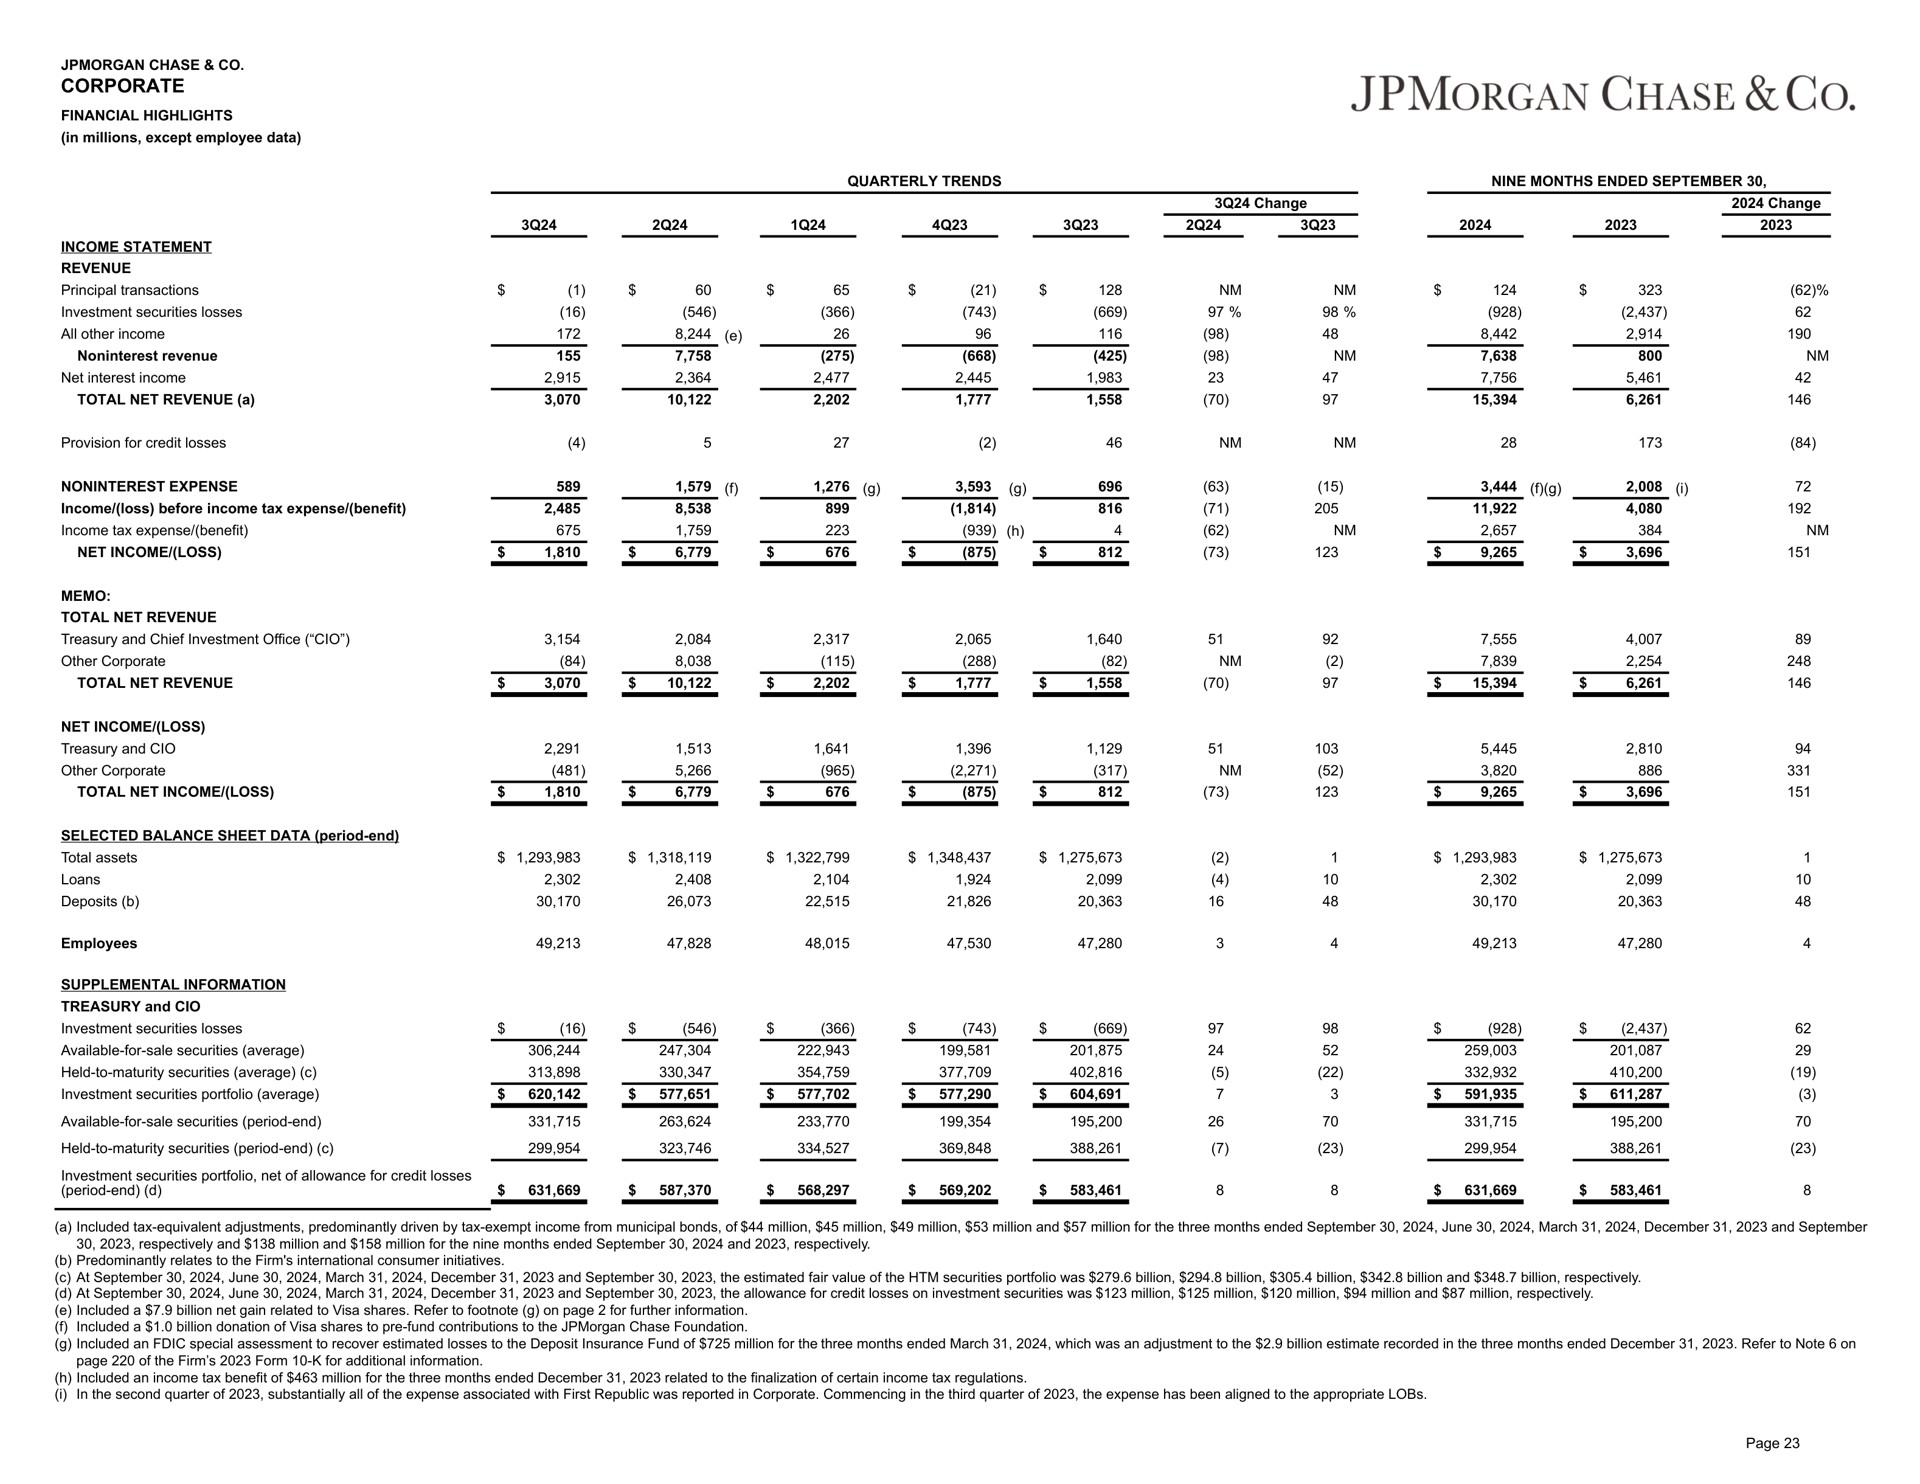
Results
January 2024
Results
January 2024
Results
January 2024
Results
January 2024
Related slides by other companies
Results
November 2022
Results
October 2023
Results
February 2023
Results
August 2023
Other recent decks by J.P.Morgan
Results
January 2024
Results
January 2024
ESG
November 2023
Results
July 2023
Search Thousands of Presentations by World Leading Companies

Stay in the loop

Join our mailing list to stay in the loop with updates and newest feature releases
© 2021-2023 Slidebook.io