Hugo Boss
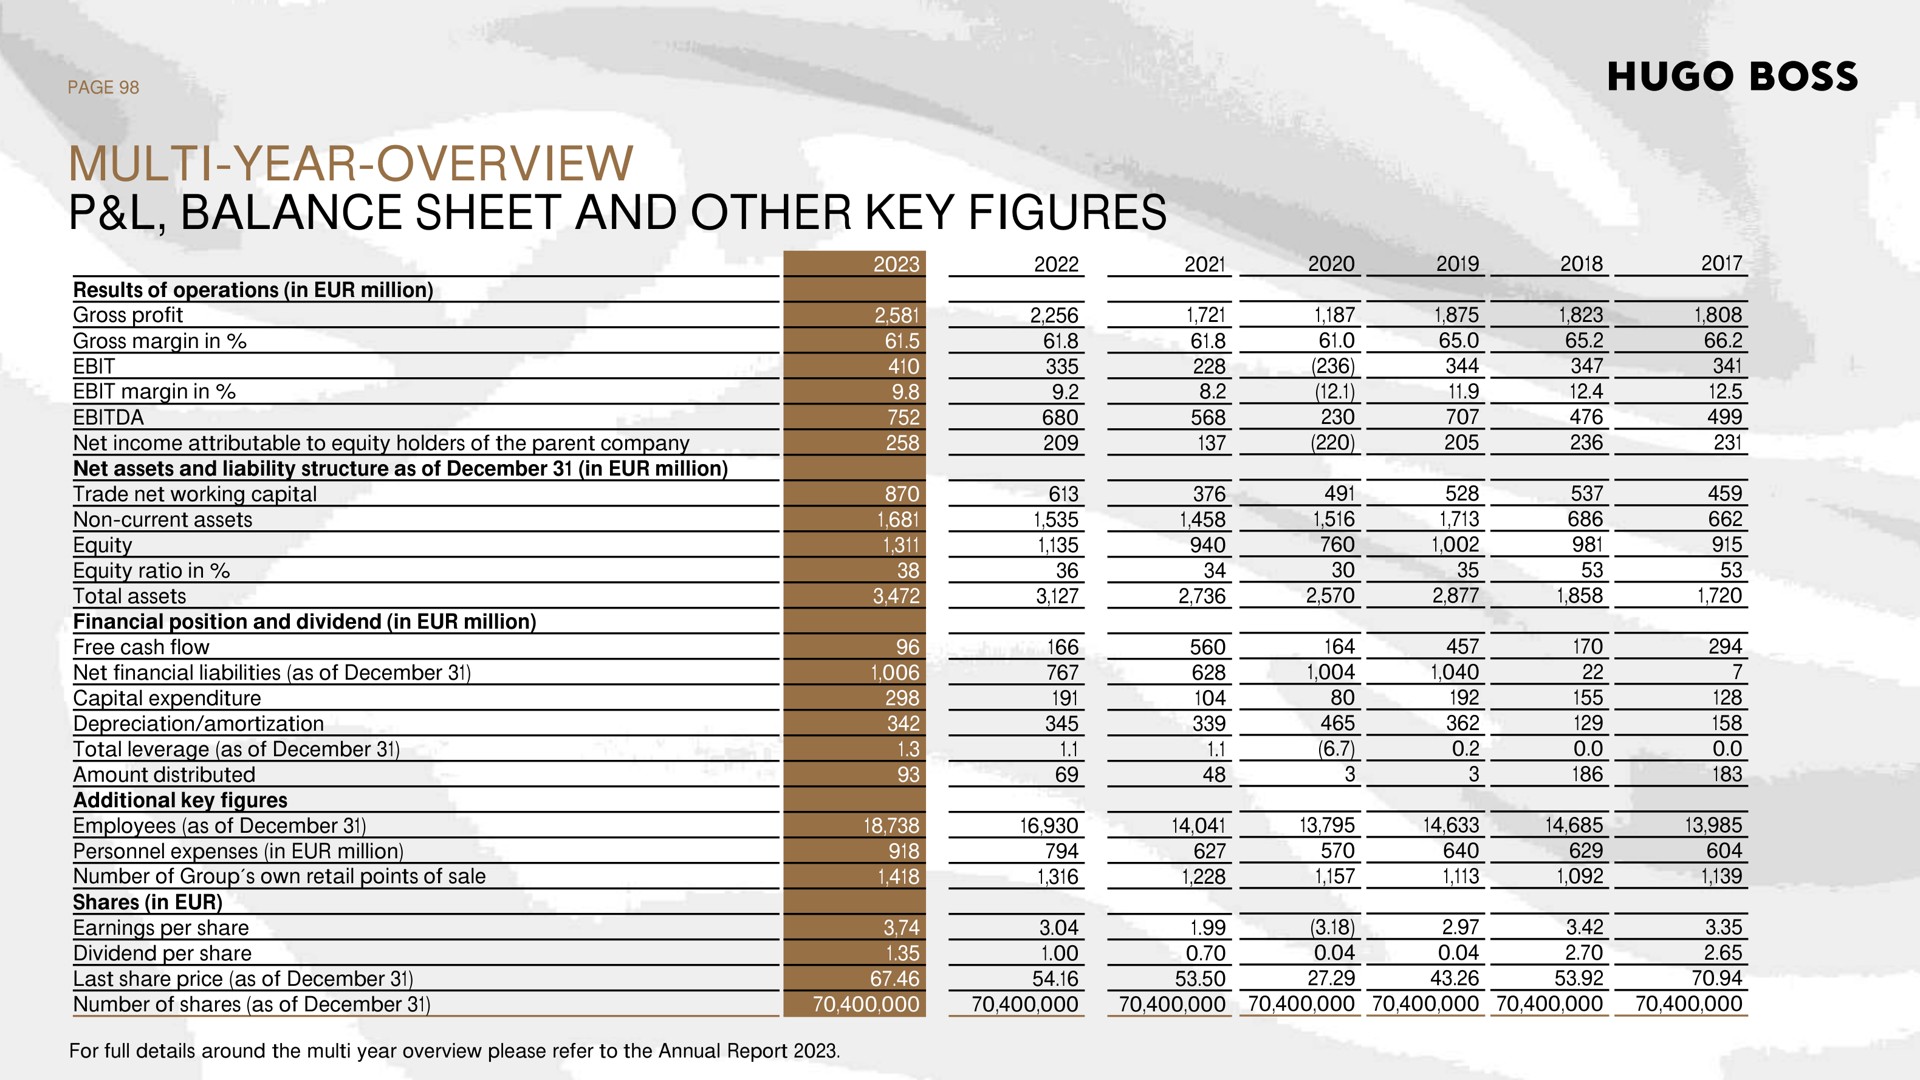
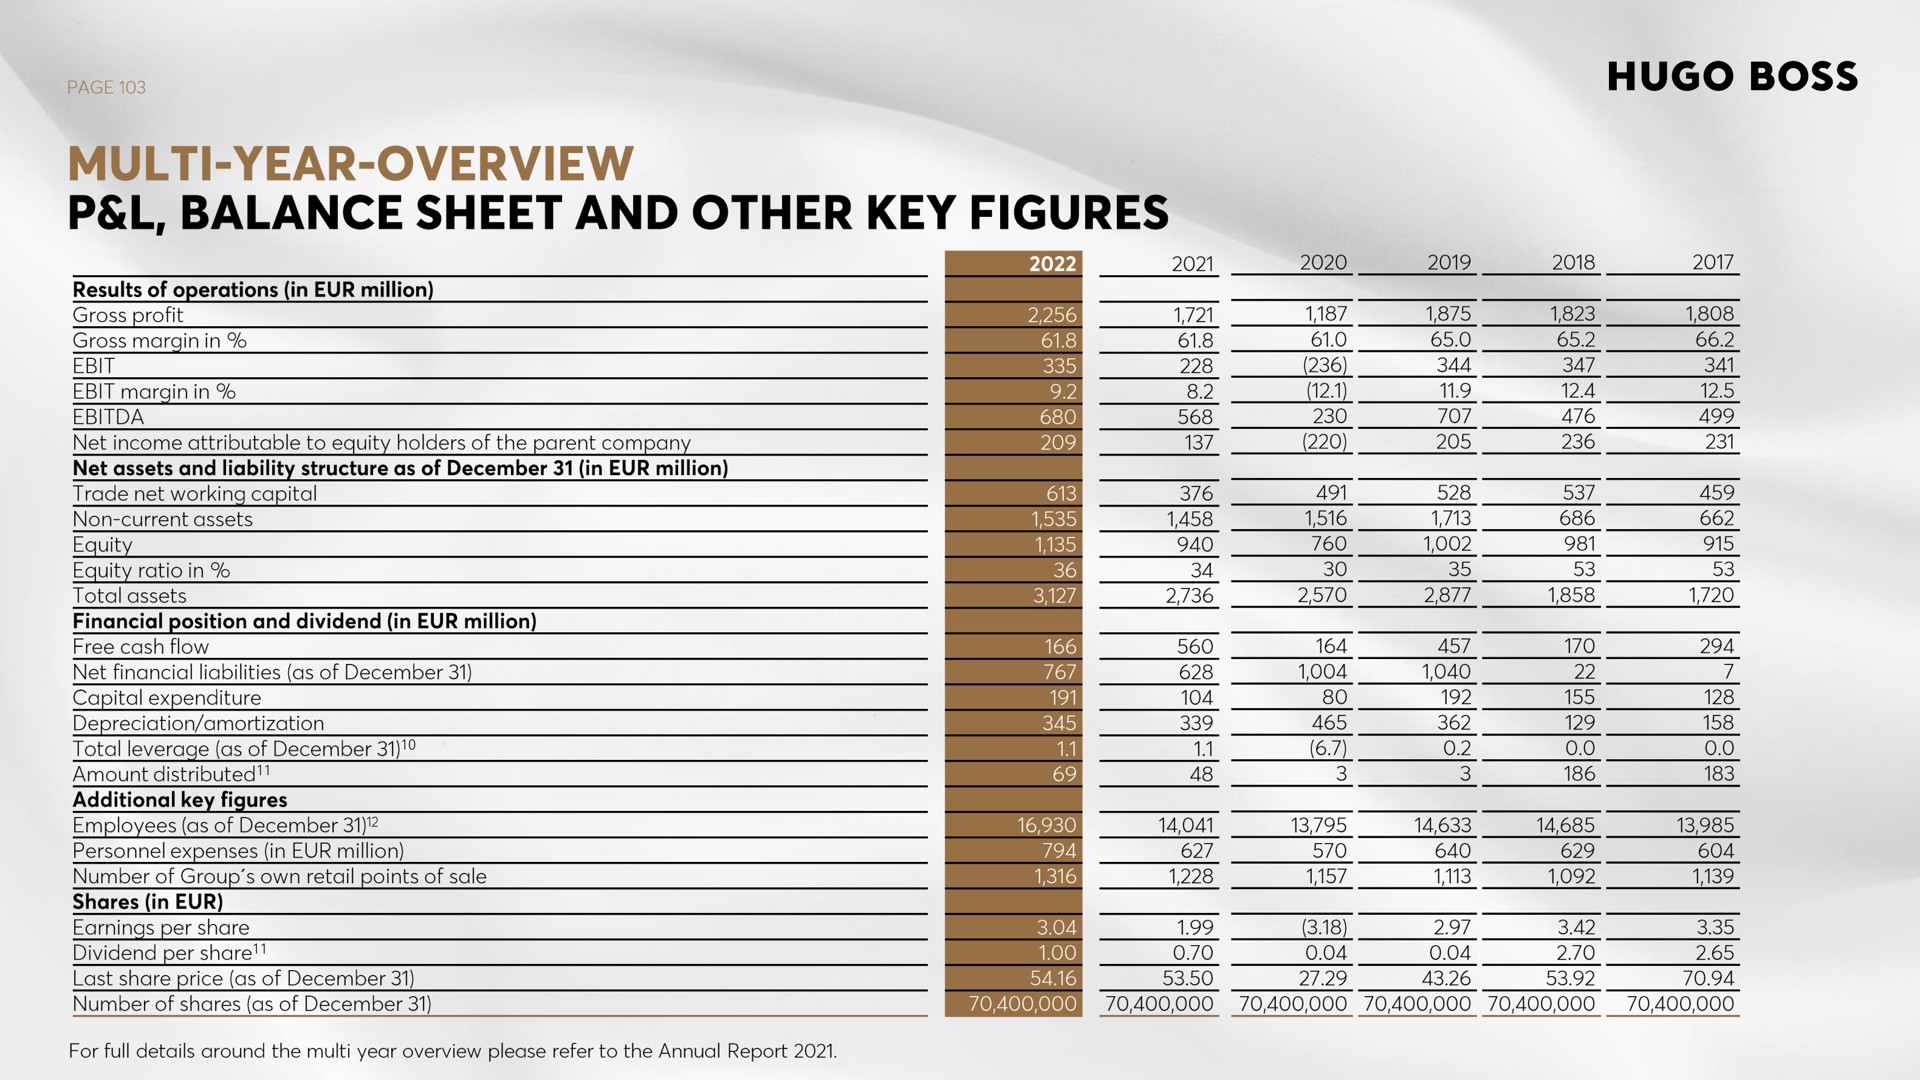
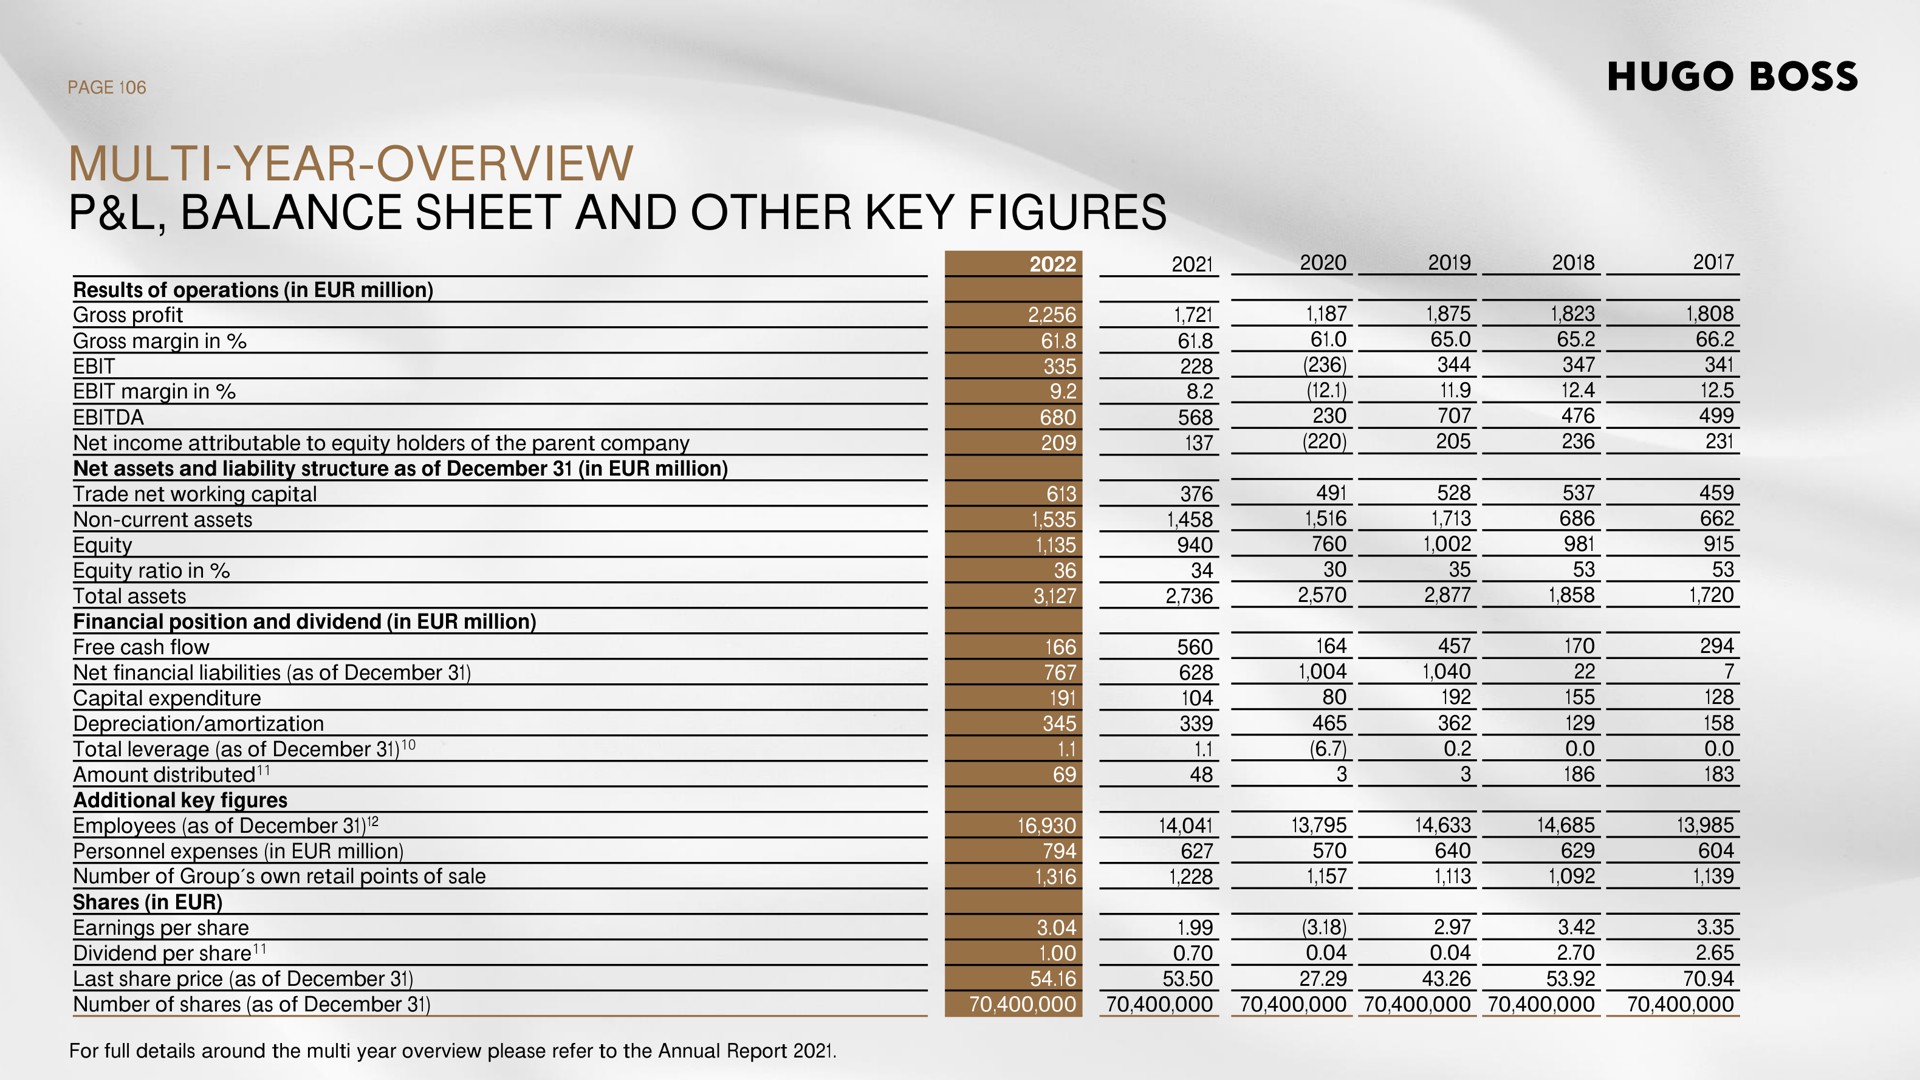
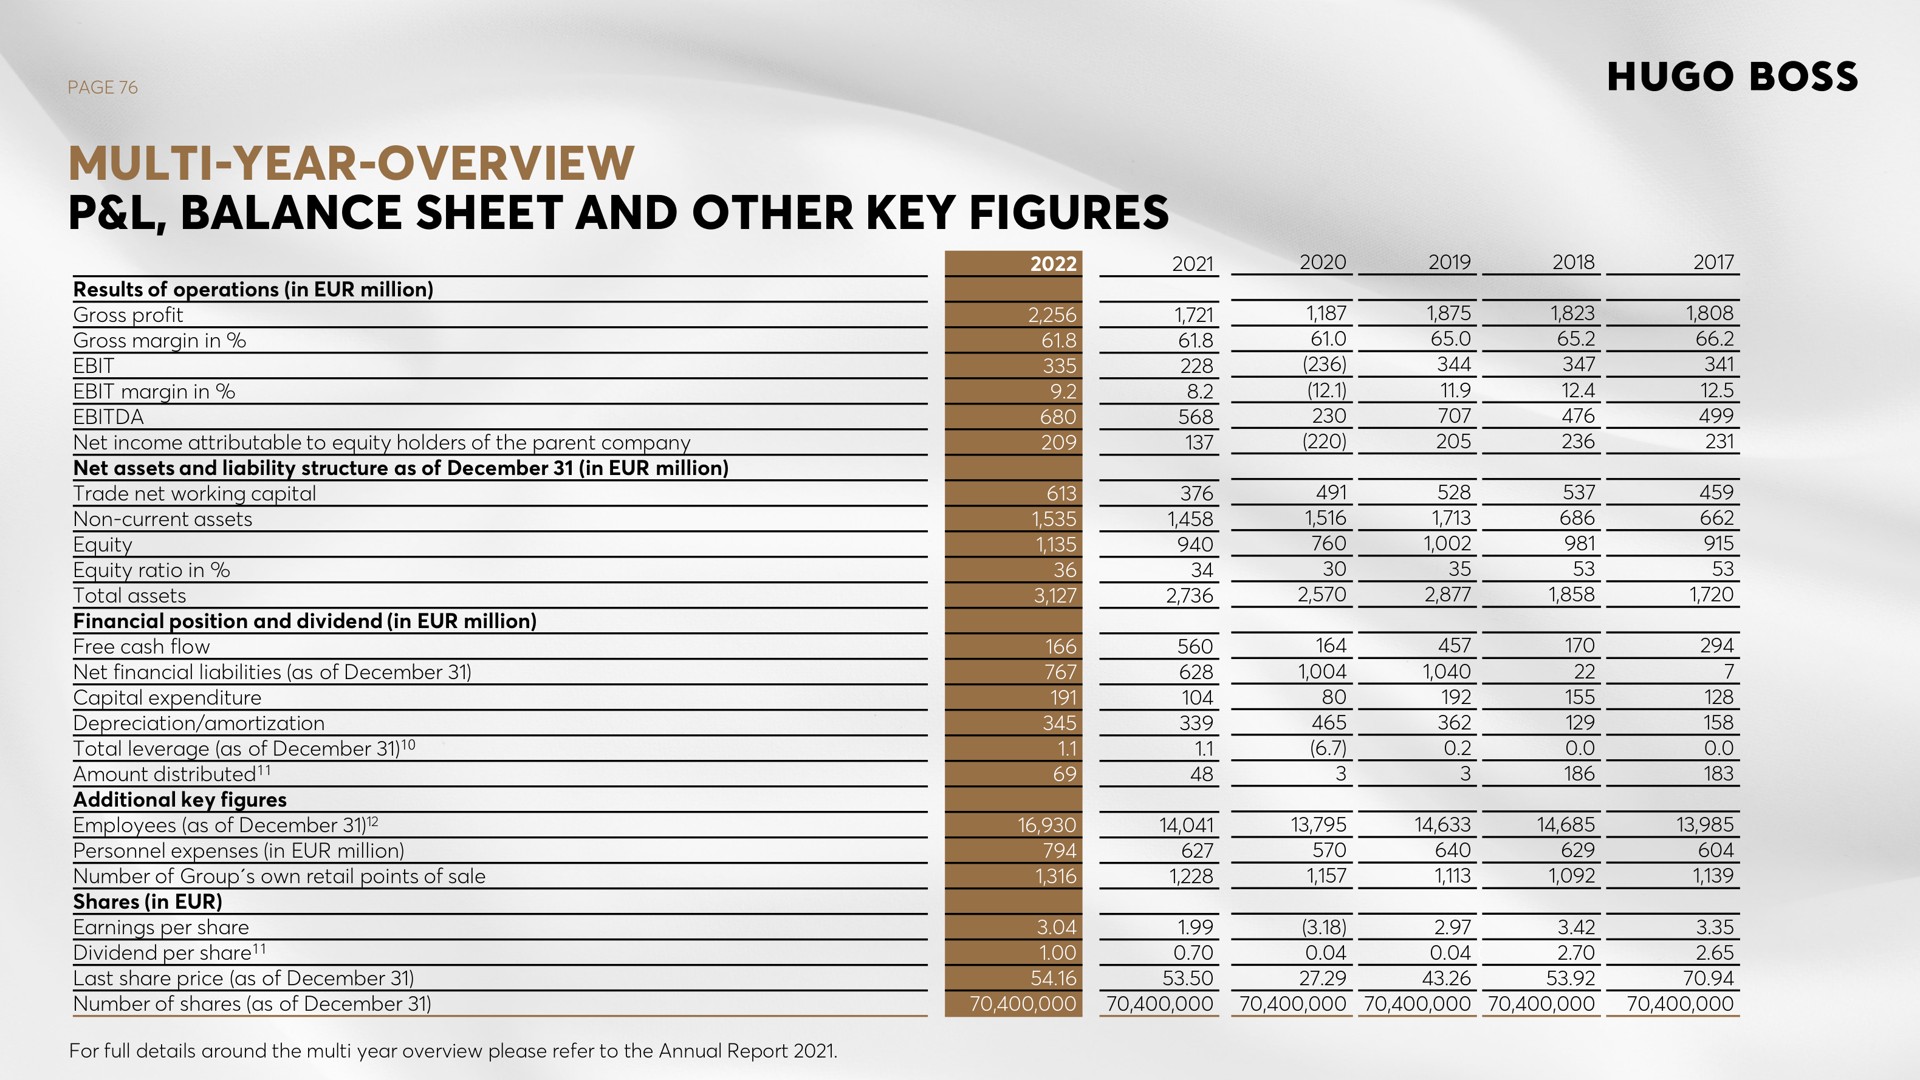
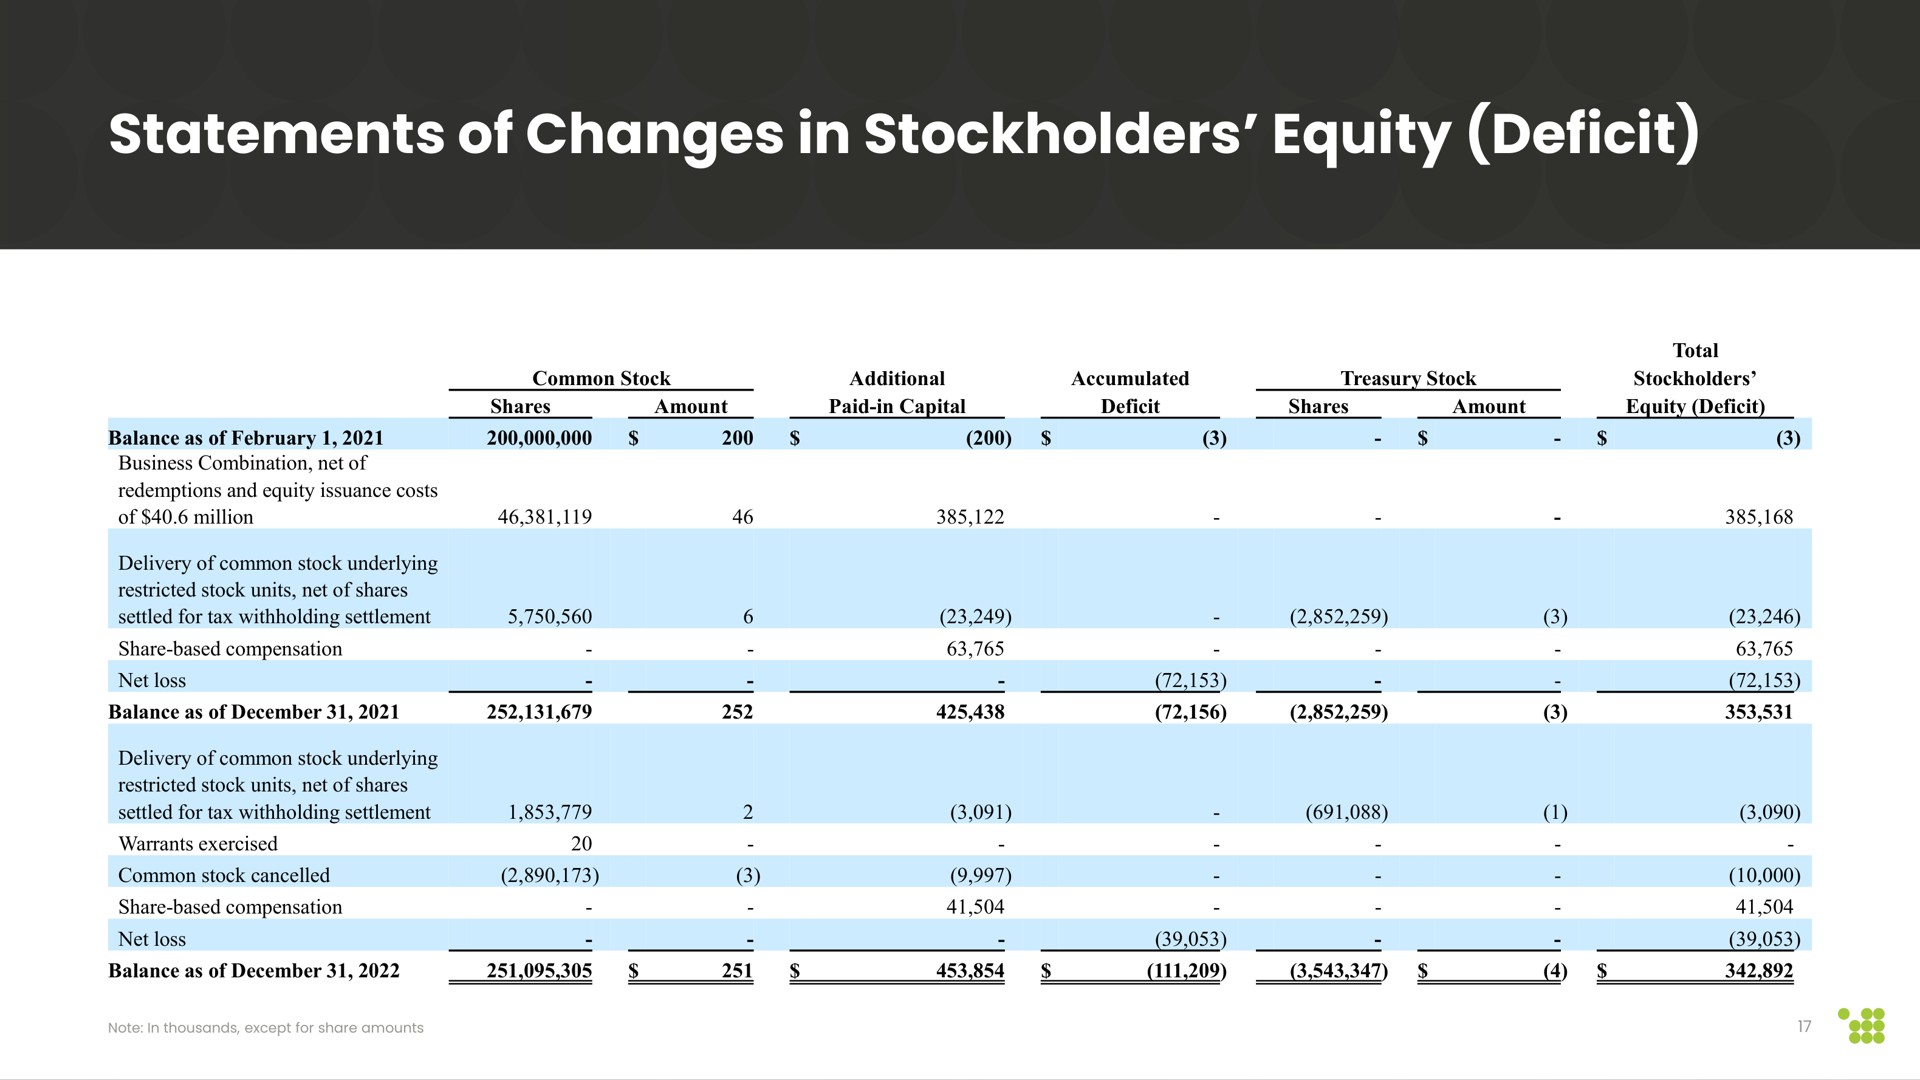
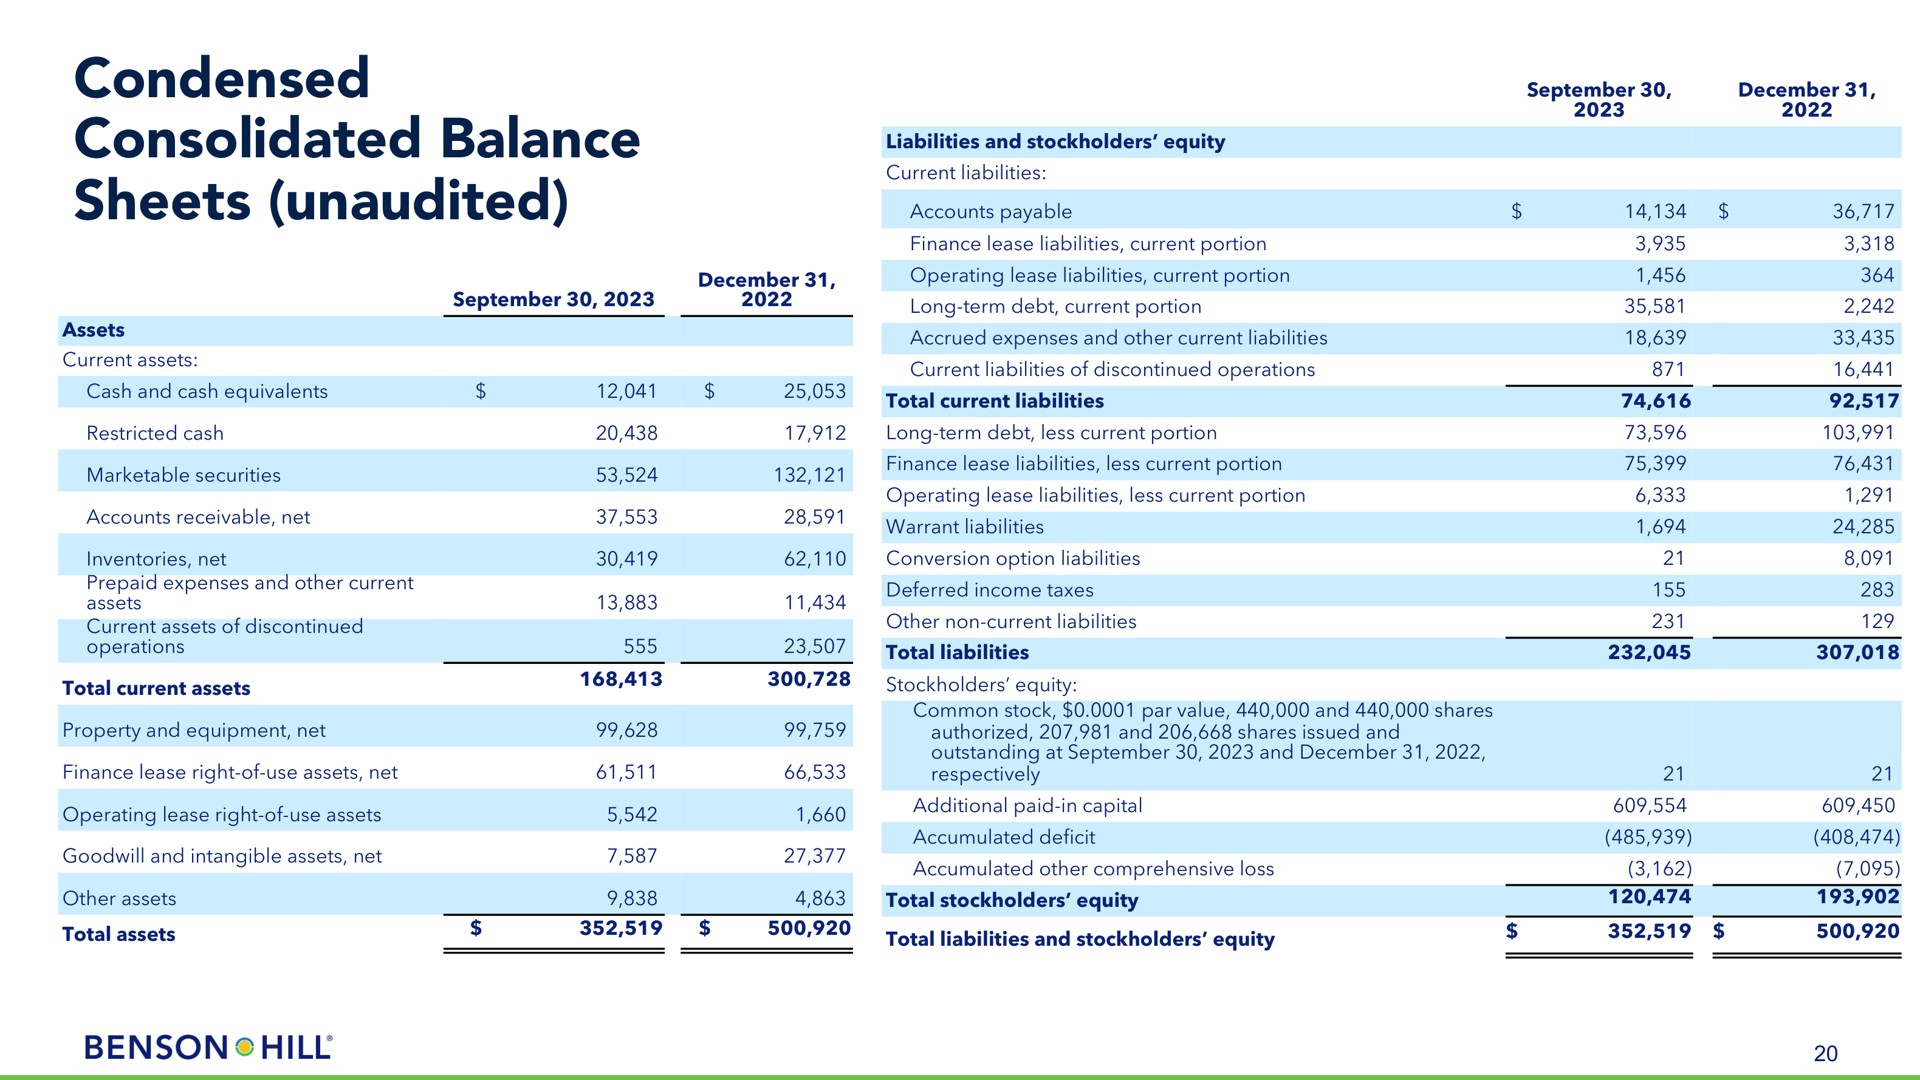
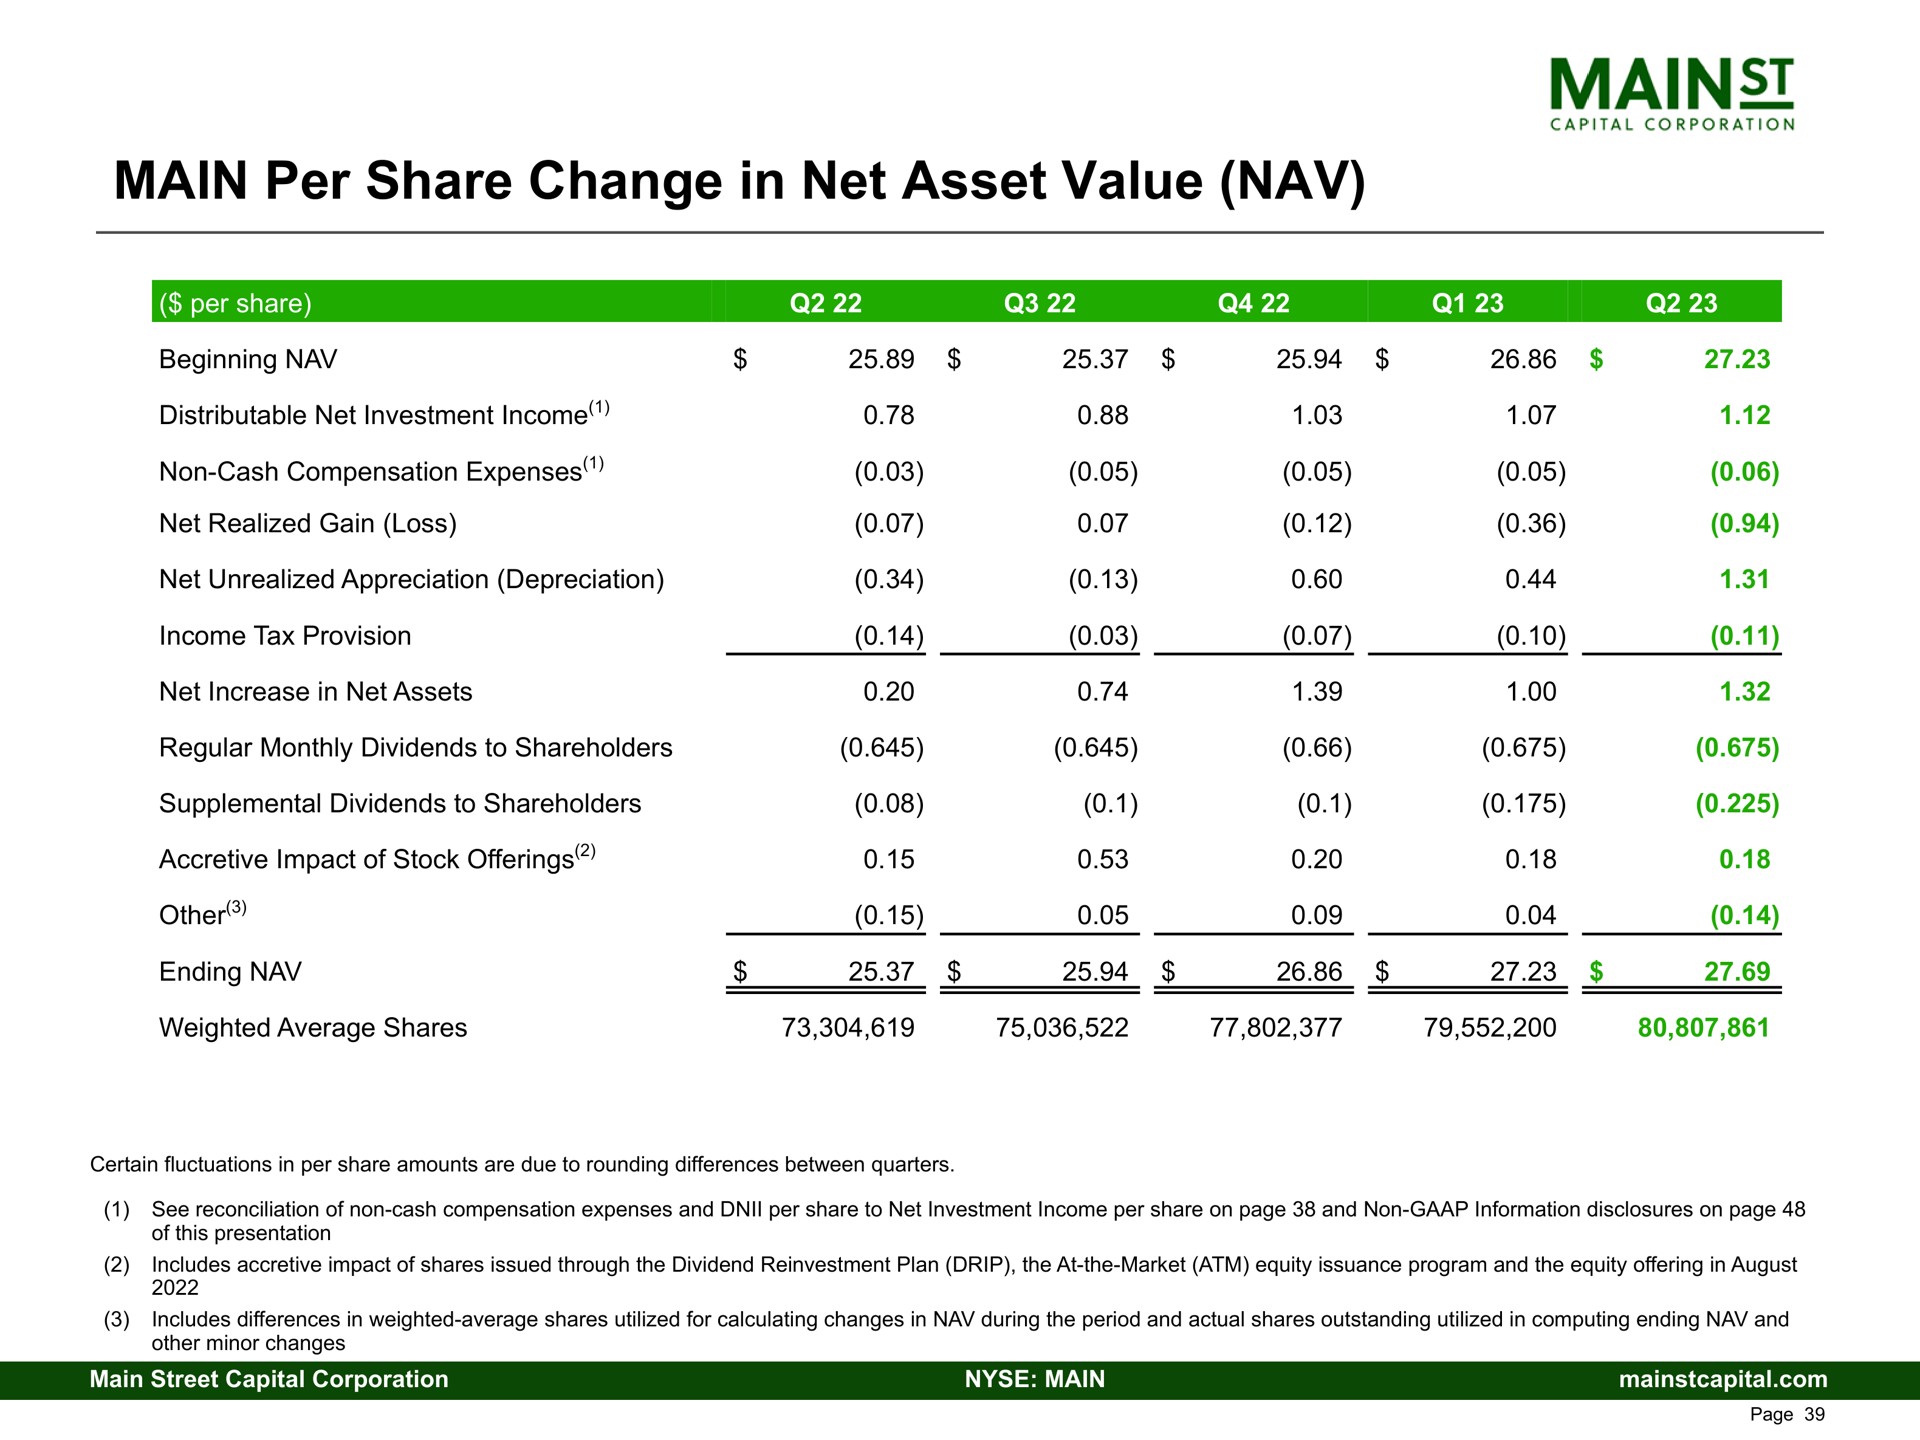
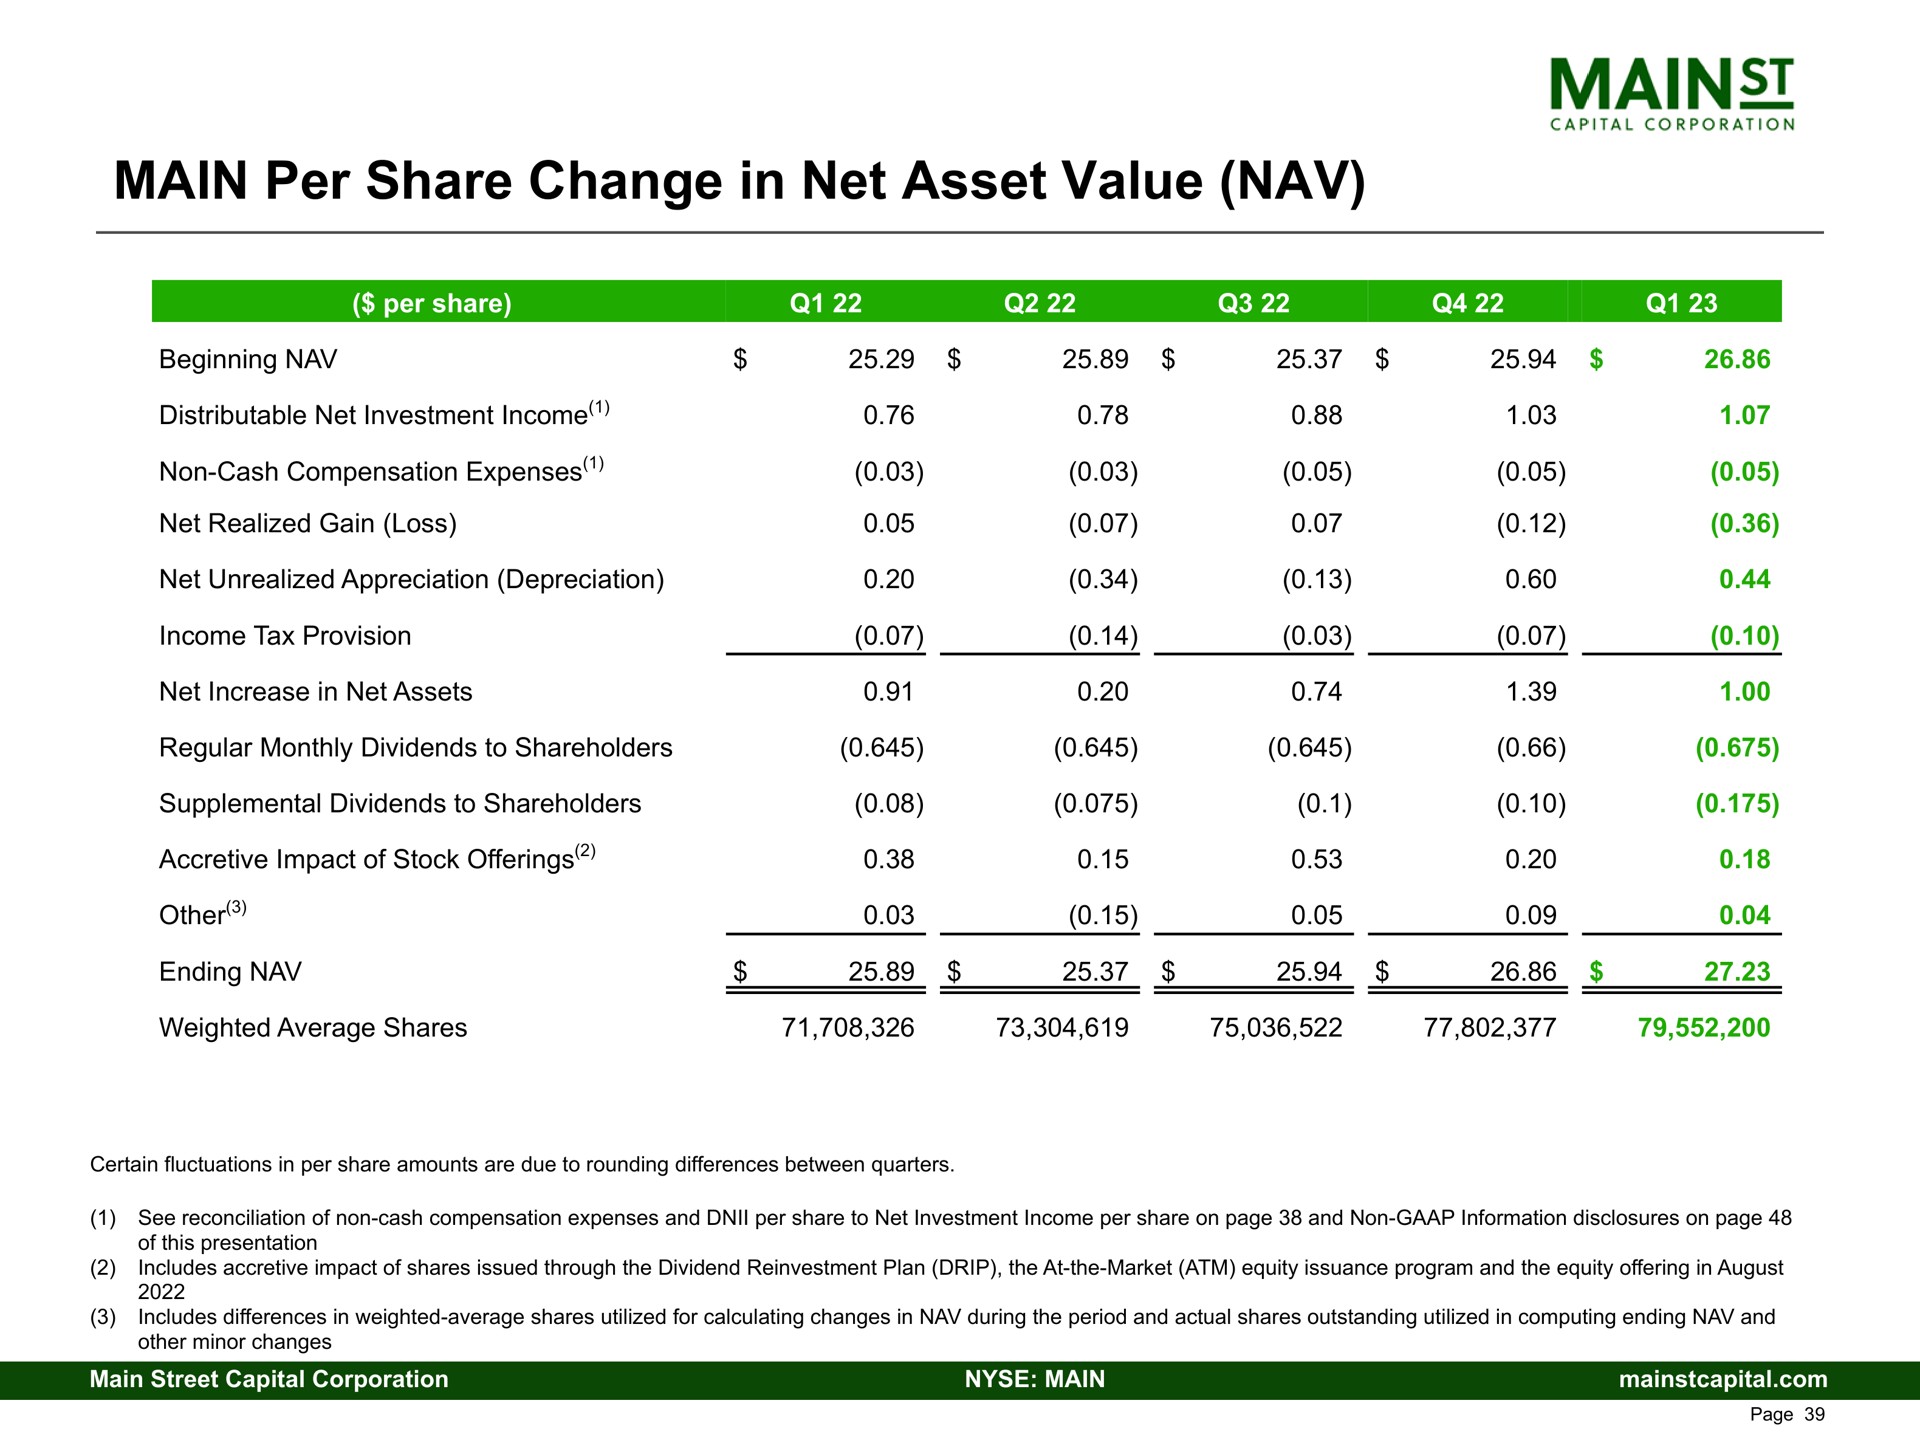
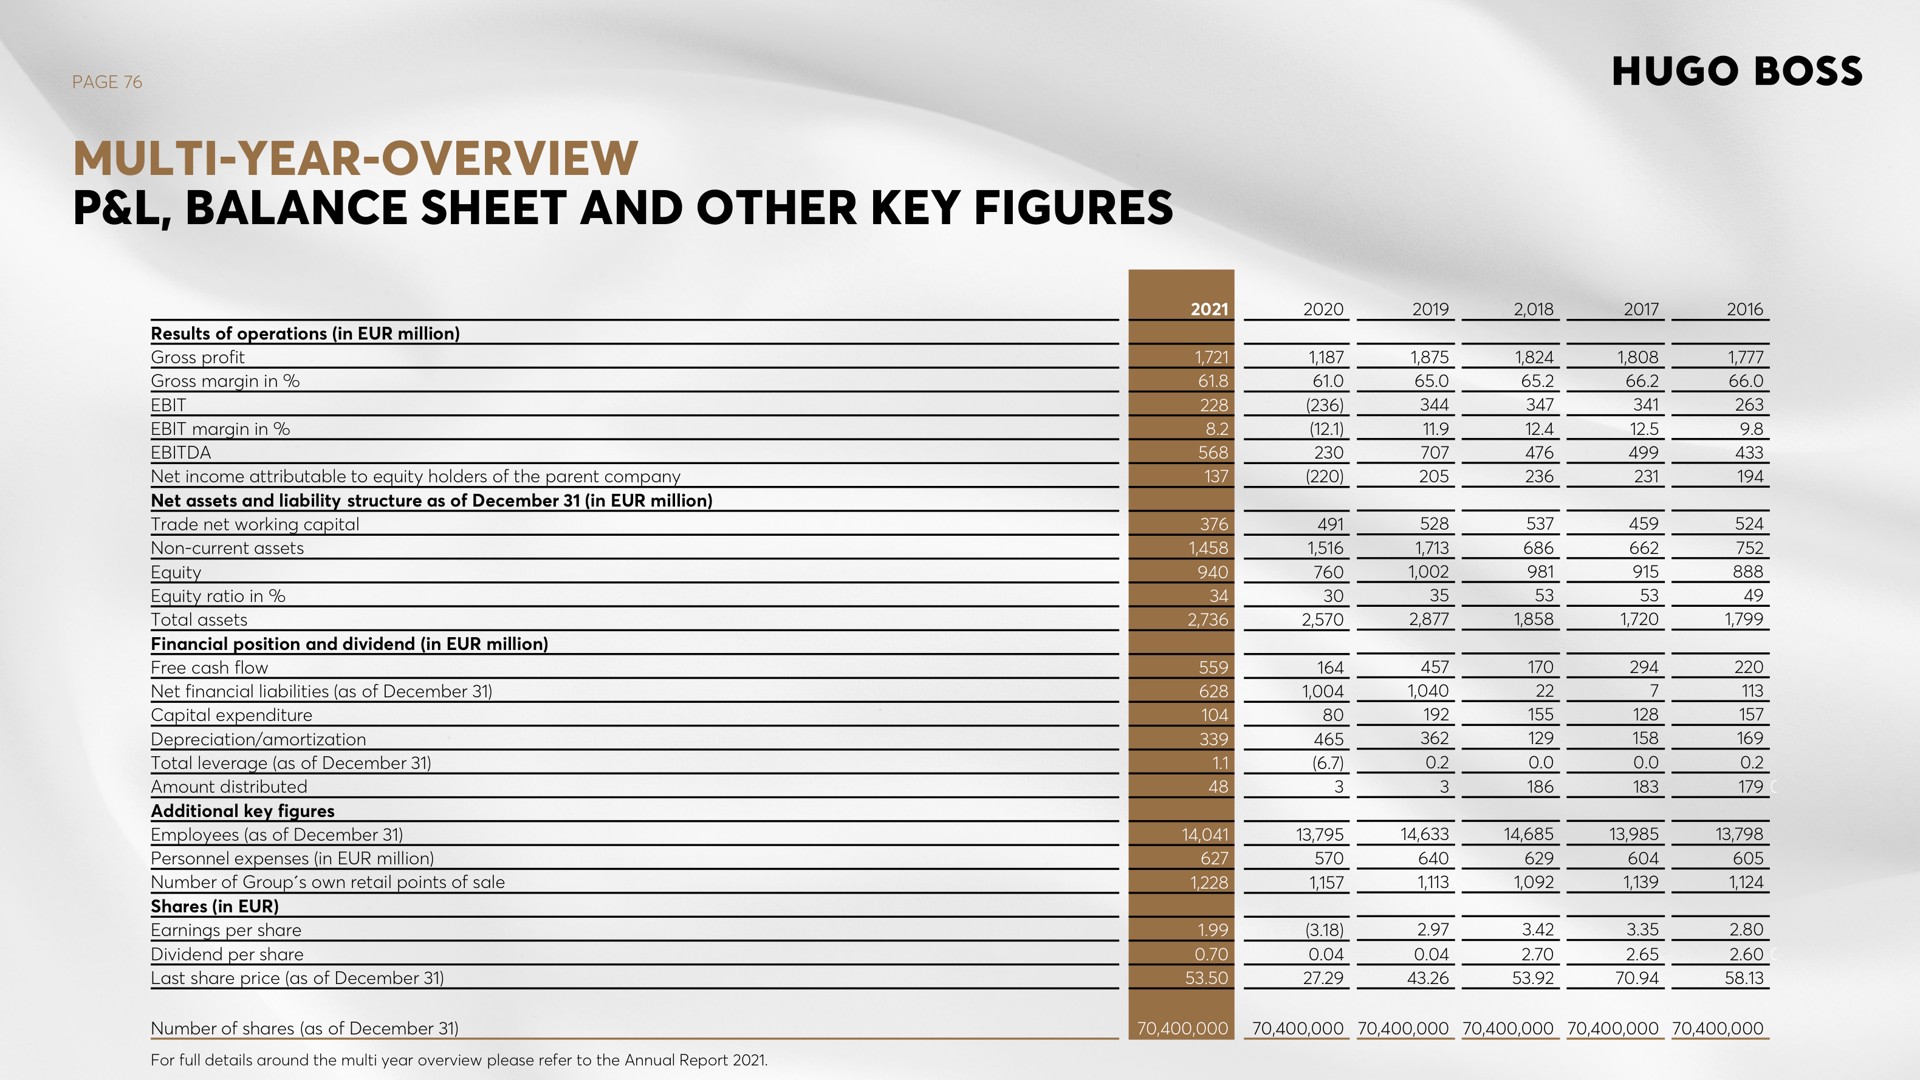
page year overview balance sheet and other key figures results of operations in million gross profit gross margin in margin in net income attributable to equity holders of the parent company net assets and liability structure as of in million trade net working capital non current assets equity equity ratio in total assets financial position and dividend in million free cash flow net financial liabilities as of capital expenditure depreciation amortization total leverage as of amount distributed additional key figures employees as of personnel expenses in million number of group own retail points of sale shares in earnings per share dividend per share last share price as of number of shares as of | Hugo Boss
Company
Deck date
May 2022
Slide
76 of 77
Similar slides by Hugo Boss
Investor Presentation
March 2024
Investor Presentation
November 2023
Investor Day
August 2023
Investor Presentation
May 2023
Related slides by other companies
Investor Presentation
March 2023
Results
November 2023
Investor Presentation
August 2023
Investor Presentation
May 2023
Other recent decks by Hugo Boss
Investor Presentation
March 2024
Results
March 2024
Investor Presentation
November 2023
Investor Presentation
November 2023
Search Thousands of Presentations by World Leading Companies

Stay in the loop

Join our mailing list to stay in the loop with updates and newest feature releases
© 2021-2023 Slidebook.io